

Ecommerce Case Study · SEO + AI Search
Client anonymized under NDA: an established off-grid living and outdoor gear ecommerce brand (Shopify), North America, 8-figure revenue. Engagement began January 1, 2026. Every number below comes straight from the client’s Google Analytics 4, Google Search Console, and Shopify, in Canadian dollars (CAD), same calendar dates year over year.
| Metric | Before (prior year) | After (9 months) | Change |
|---|---|---|---|
| Organic revenue (Google SEO), Jan 1 to Sep 14 | $624,599 | $1,037,106 | +66% |
| AI revenue, attributed (tagged to ChatGPT, Copilot, etc.) | $11,699 | $52,585 | +349% |
| Direct revenue (untagged AI) | $999,257 | $1,815,034 | +82% |
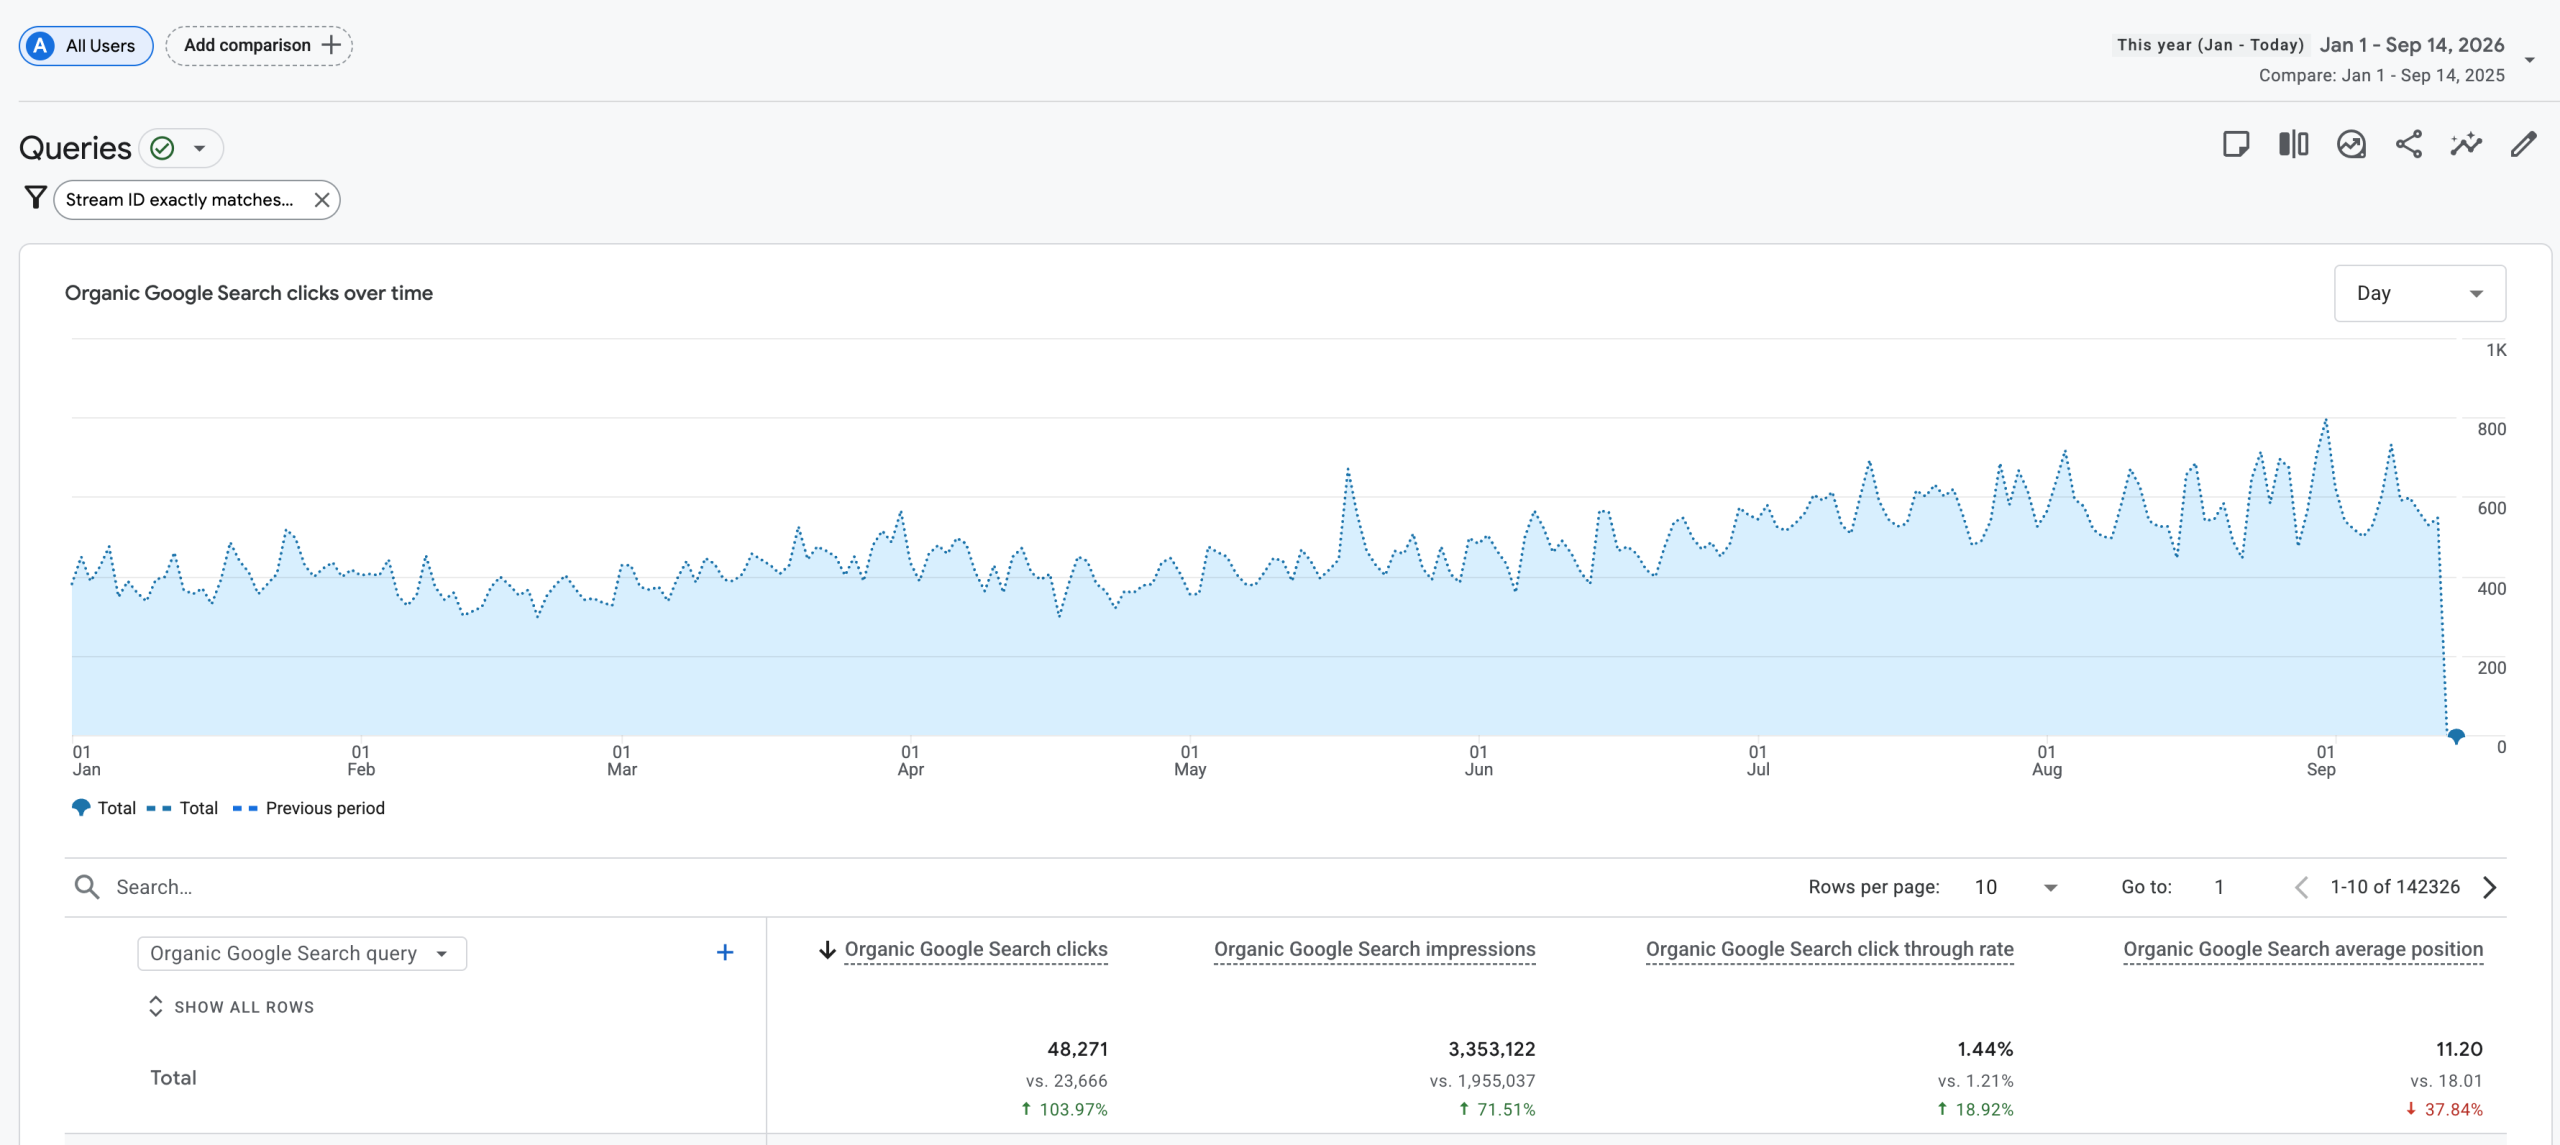
| Organic Google clicks | 23,666 | 48,271 | +104% |
| Organic Google impressions | 1,955,037 | 3,353,122 | +71% |
| Average Google position | 18.1 | 11.2 | improved |
| Google AI-feature impressions | not tracked yet | 381,000 | new channel |
An off-grid living and outdoor gear ecommerce brand on Shopify, North America, 8-figure revenue (anonymized). Nine-month engagement, started January 1, 2026. Currency: CAD.
This was not a rescue. The brand already did real volume with a large catalog; organic just was not pulling its weight. Starting January 1, 2026, we ran our standard ecommerce playbook, nothing exotic:
Nine months later, here is what happened.
Organic revenue from Google Analytics 4, same dates year over year:
| Organic revenue (GA4) | Prior year 2025 | This year 2026 | Change |
|---|---|---|---|
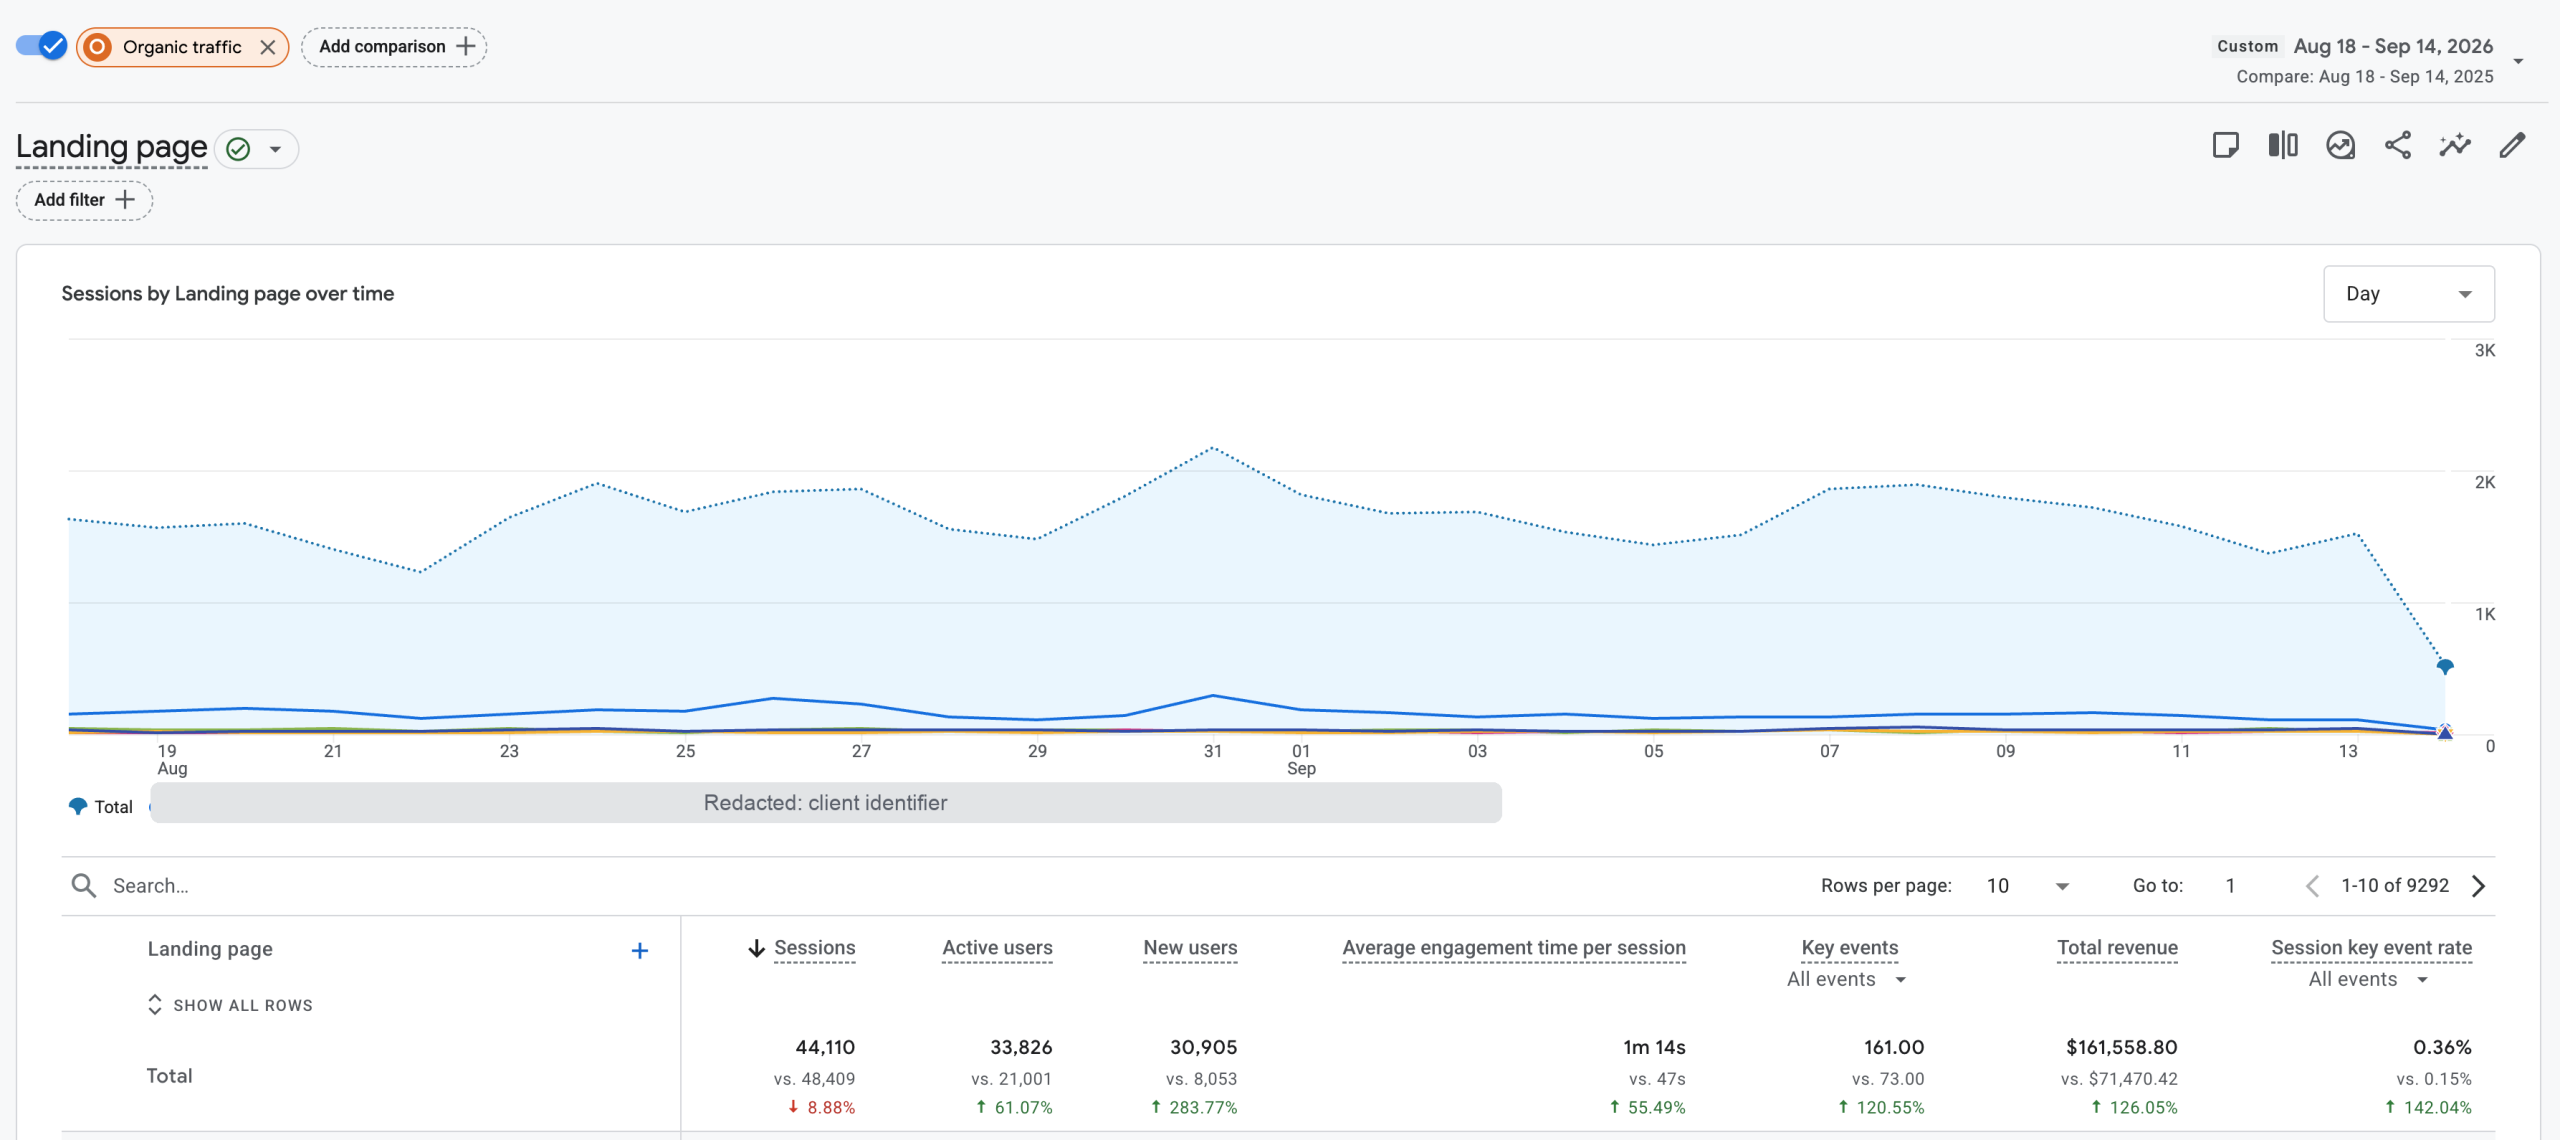
| Last 28 days (Aug 18 to Sep 14) | $71,470.42 | $161,558.80 | +142.04% |
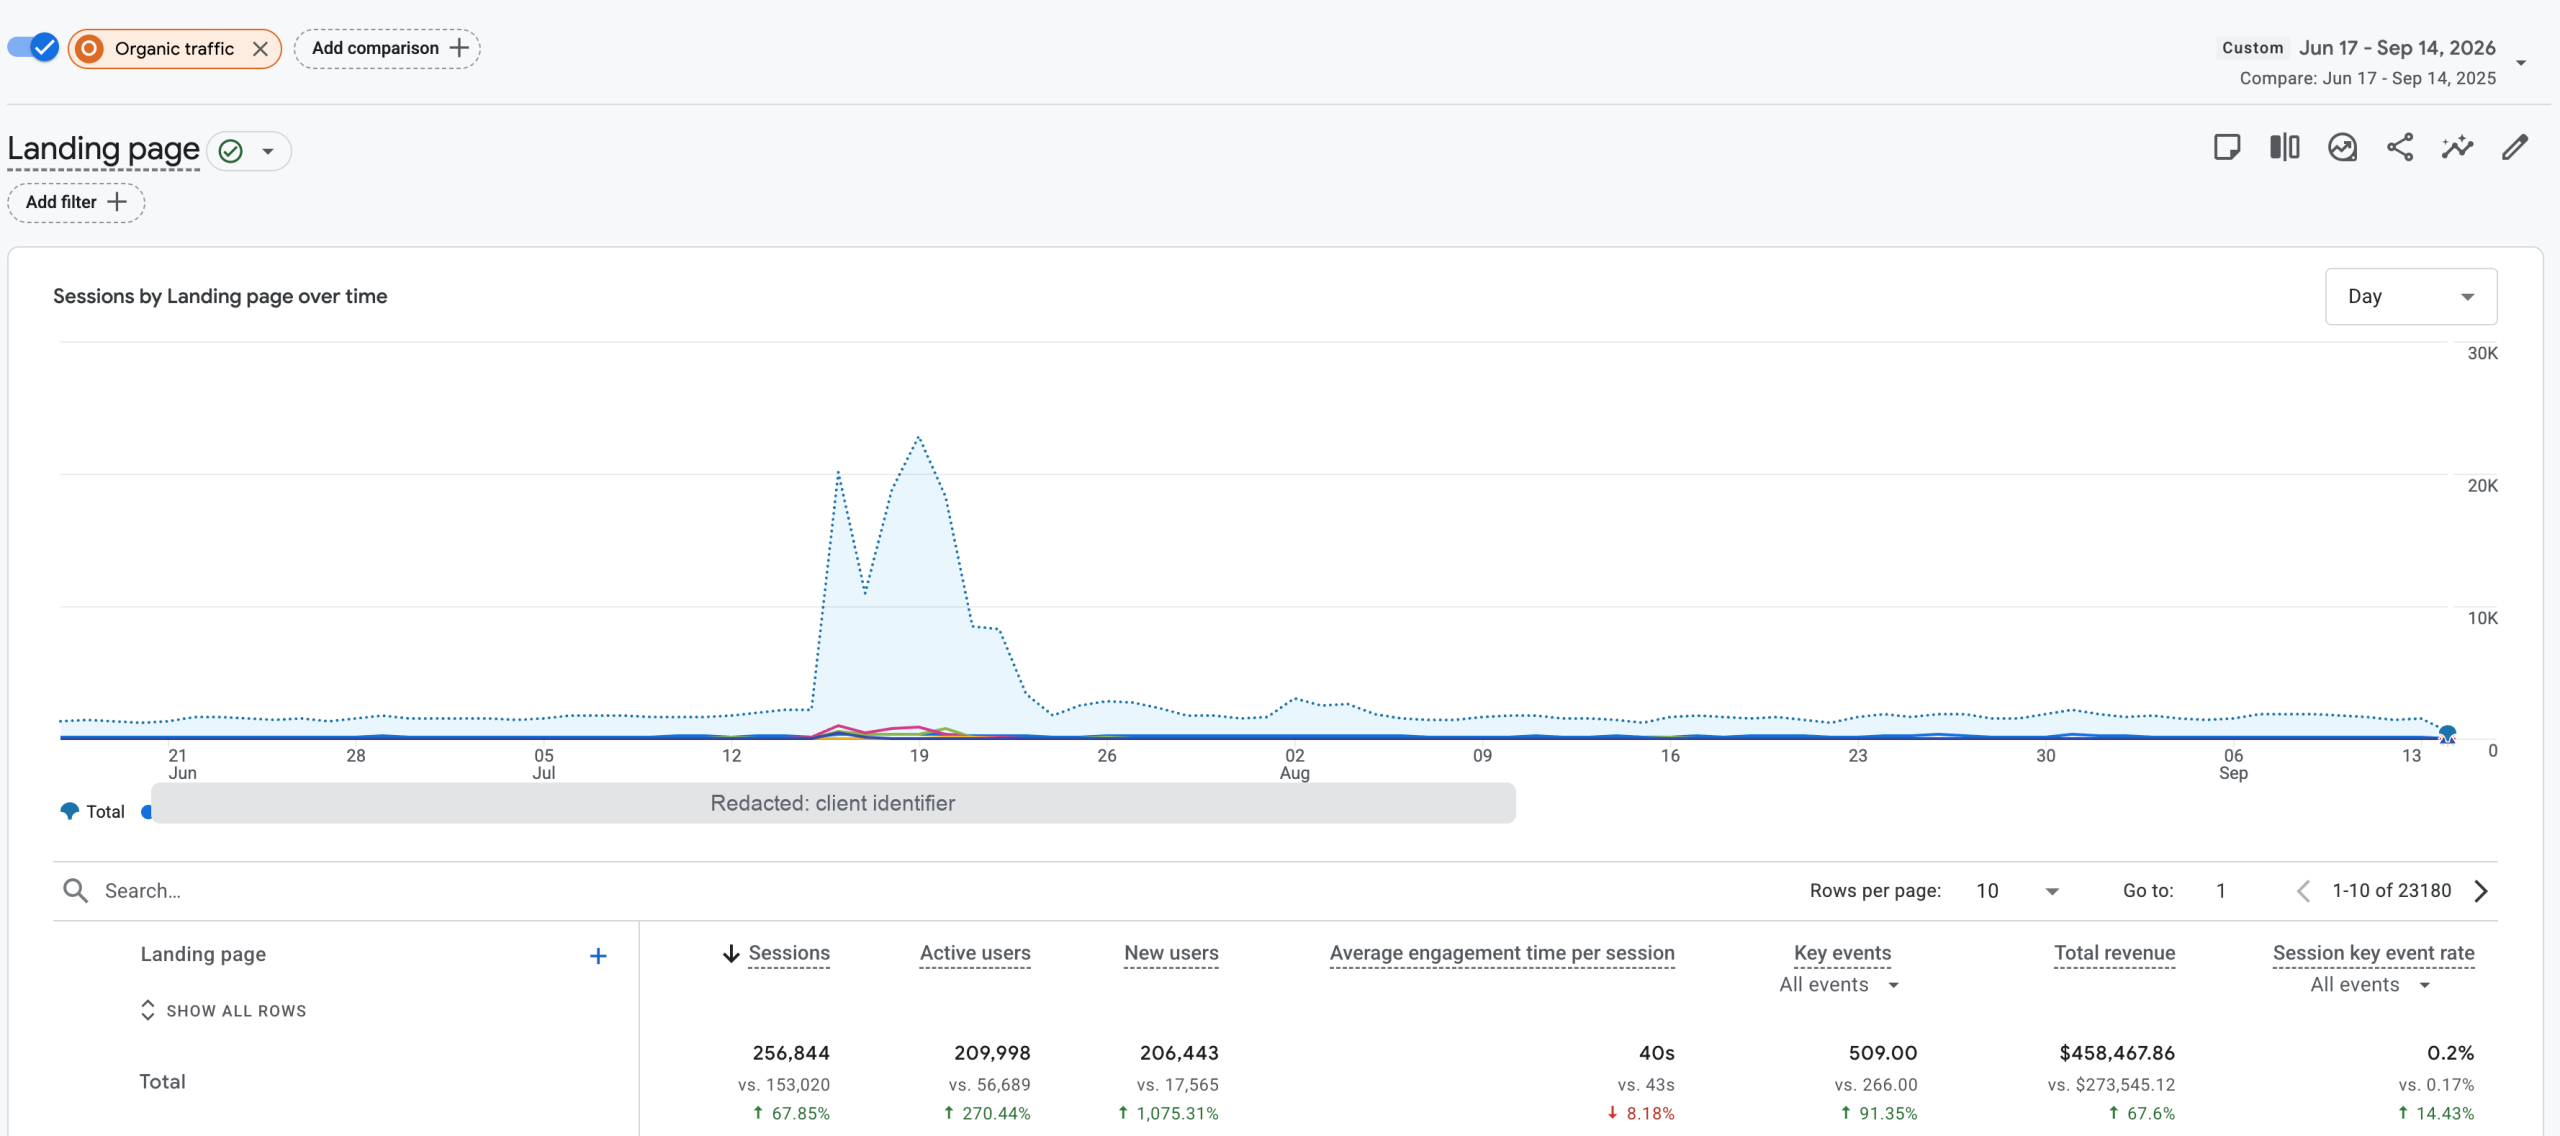
| Last 90 days (Jun 17 to Sep 14) | $273,545 | $458,468 | +67.6% |
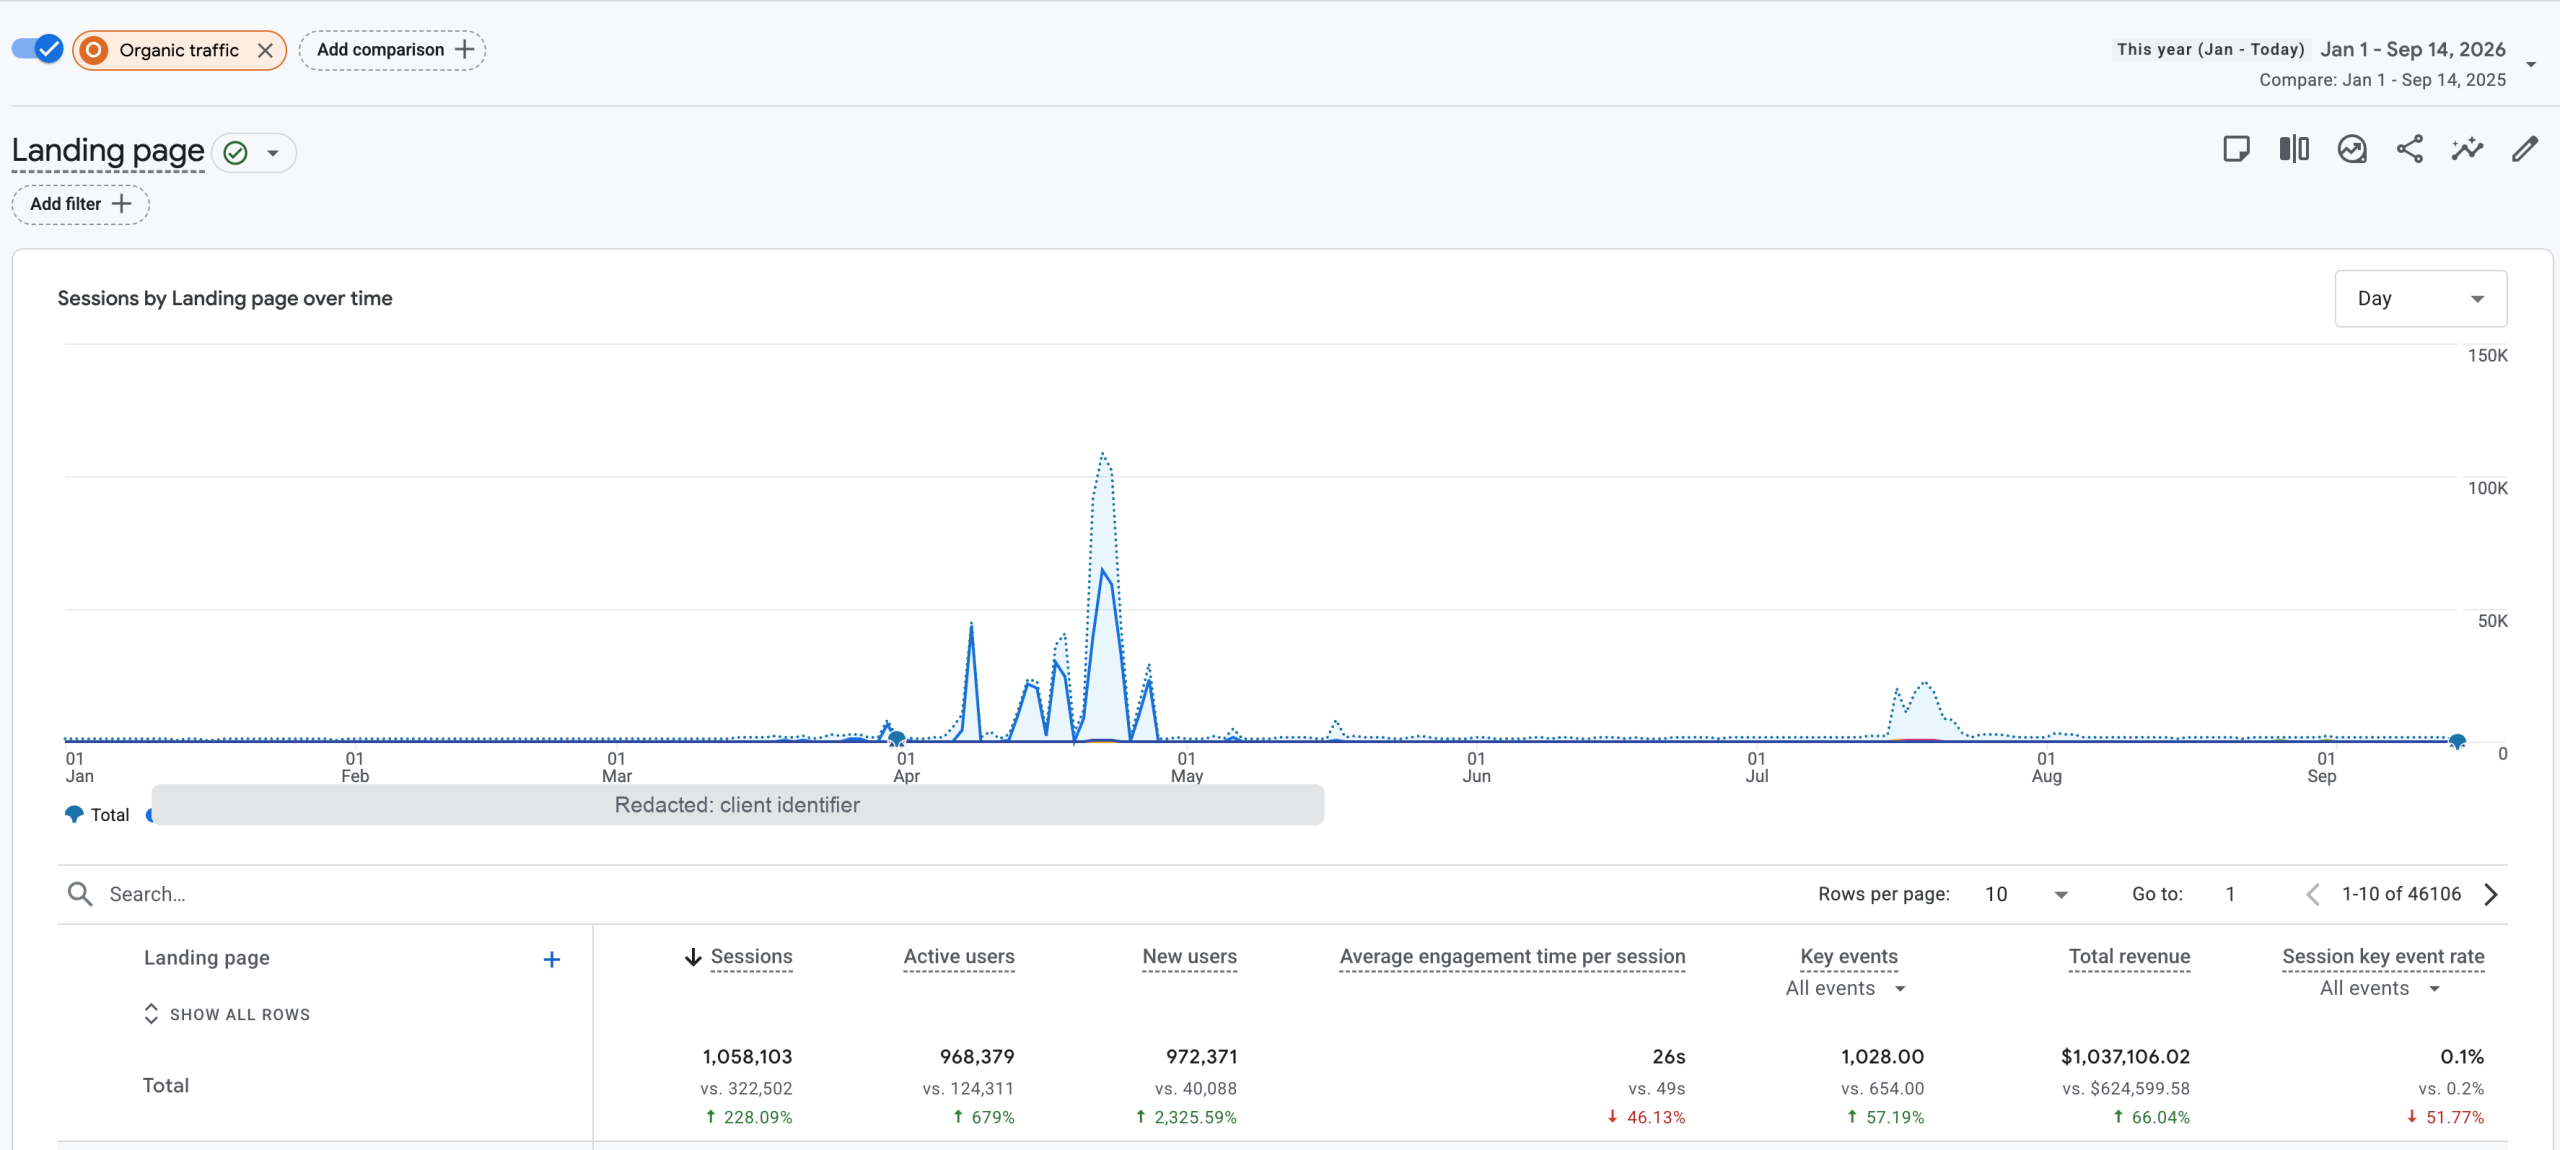
| Year to date (Jan 1 to Sep 14) | $624,599 | $1,037,106 | +66.04% |
That is an added $412,506 in organic revenue year to date, and the most recent 28 days are growing more than twice as fast as the year-to-date rate, so it is still accelerating.
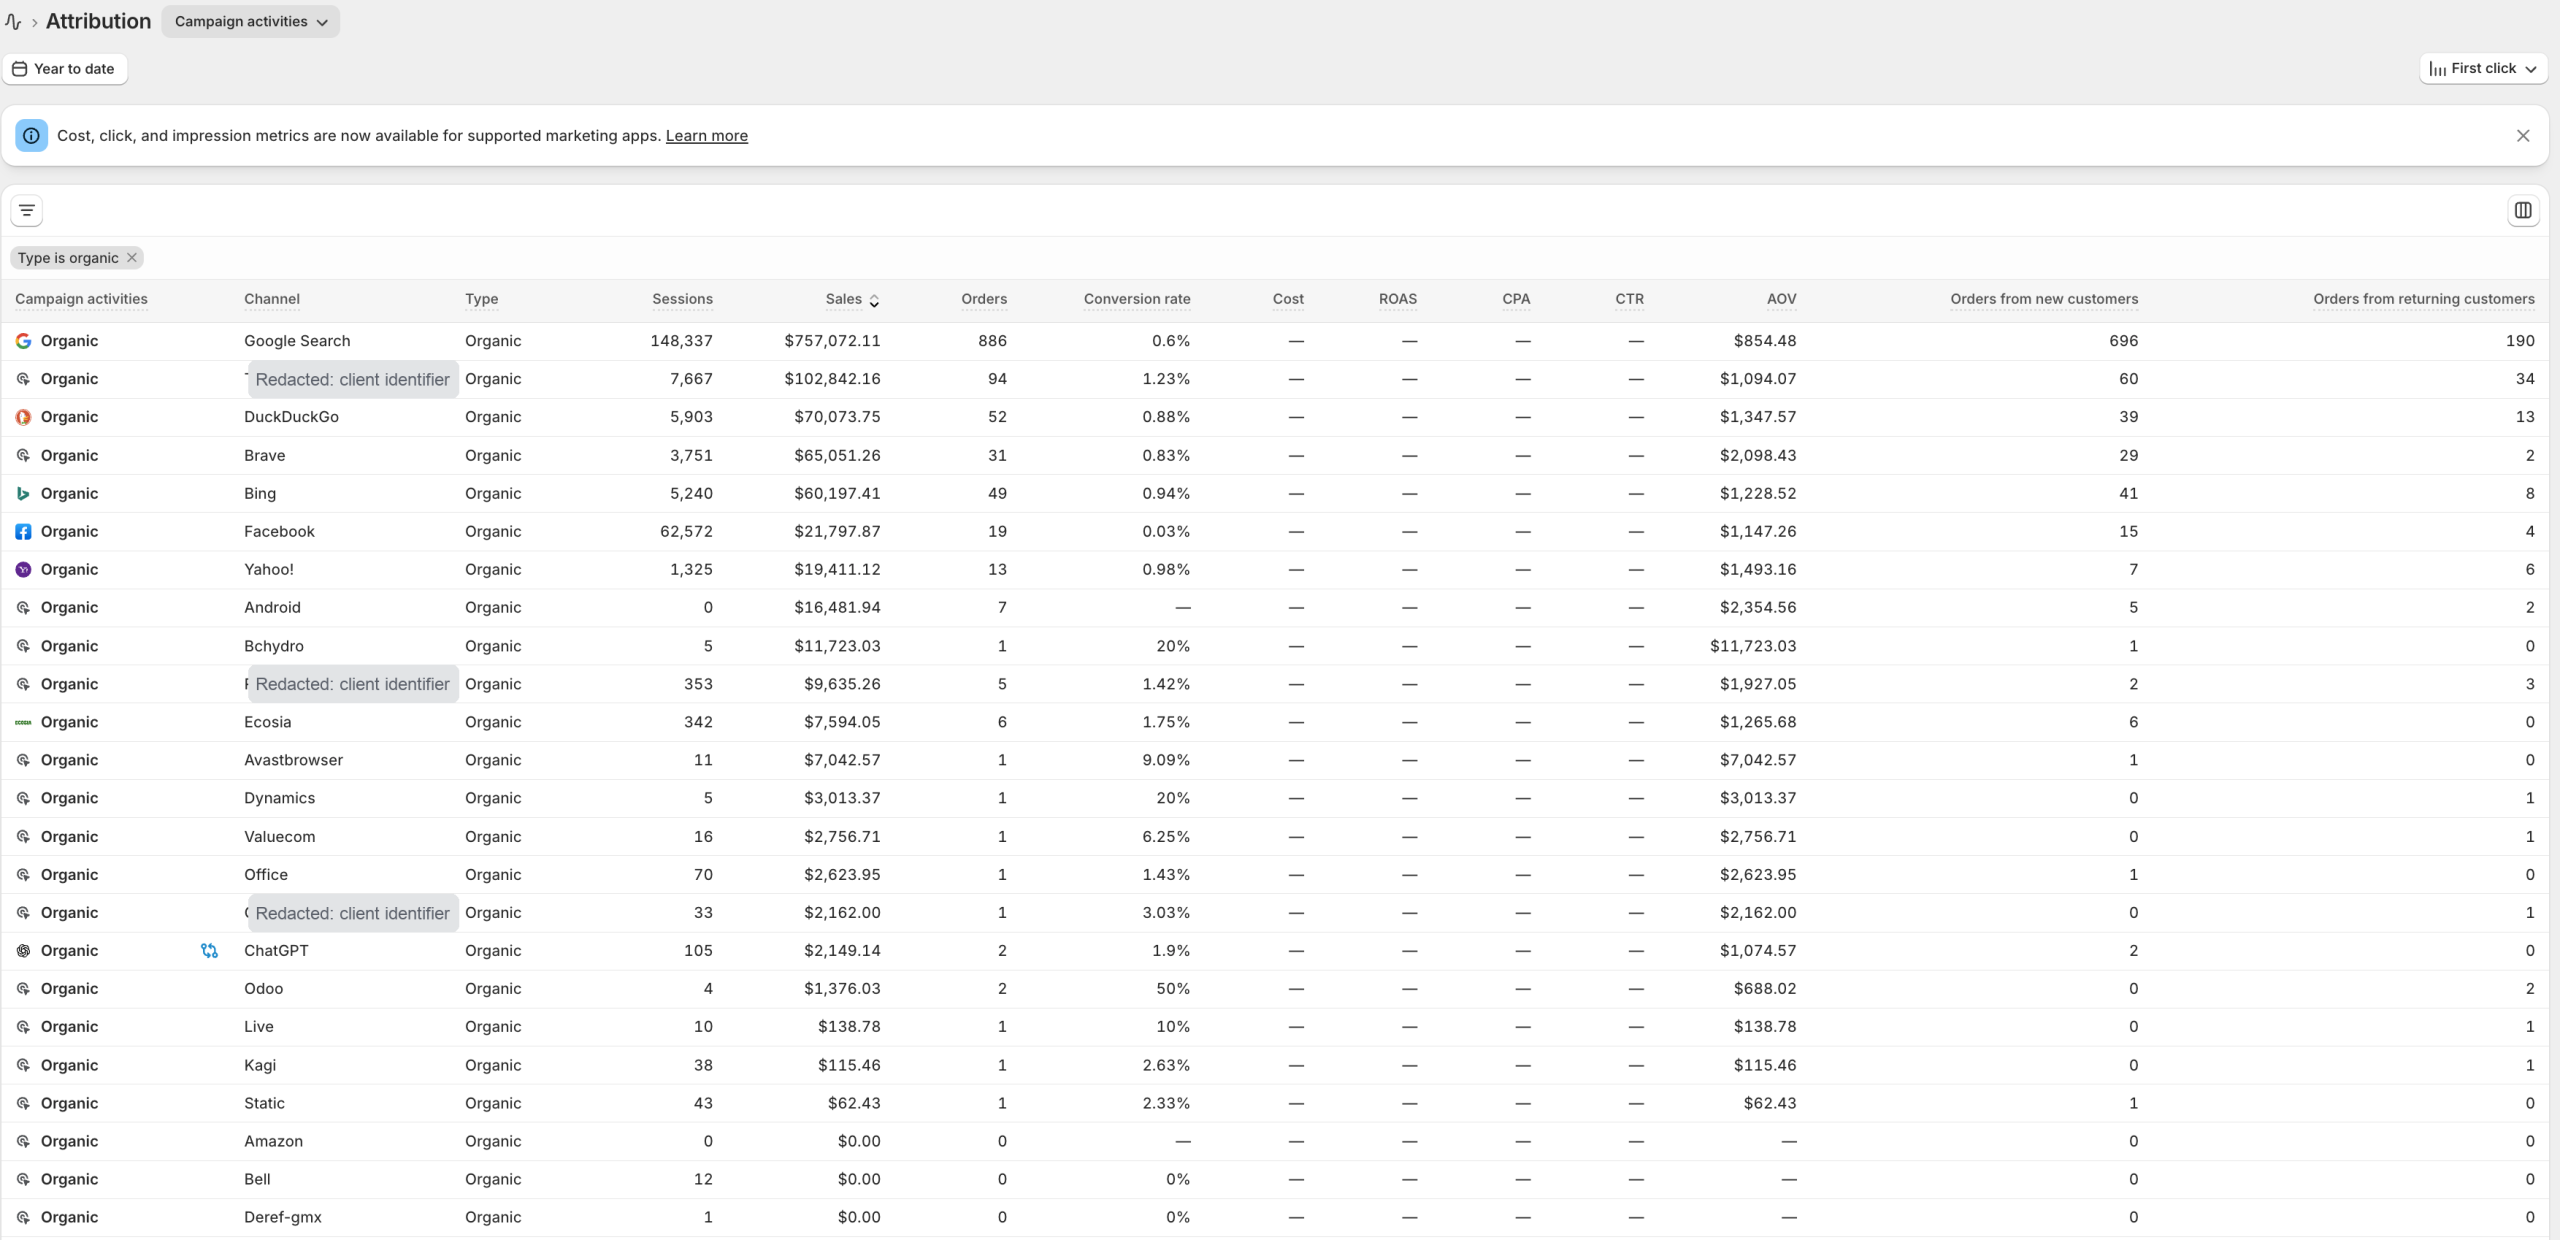
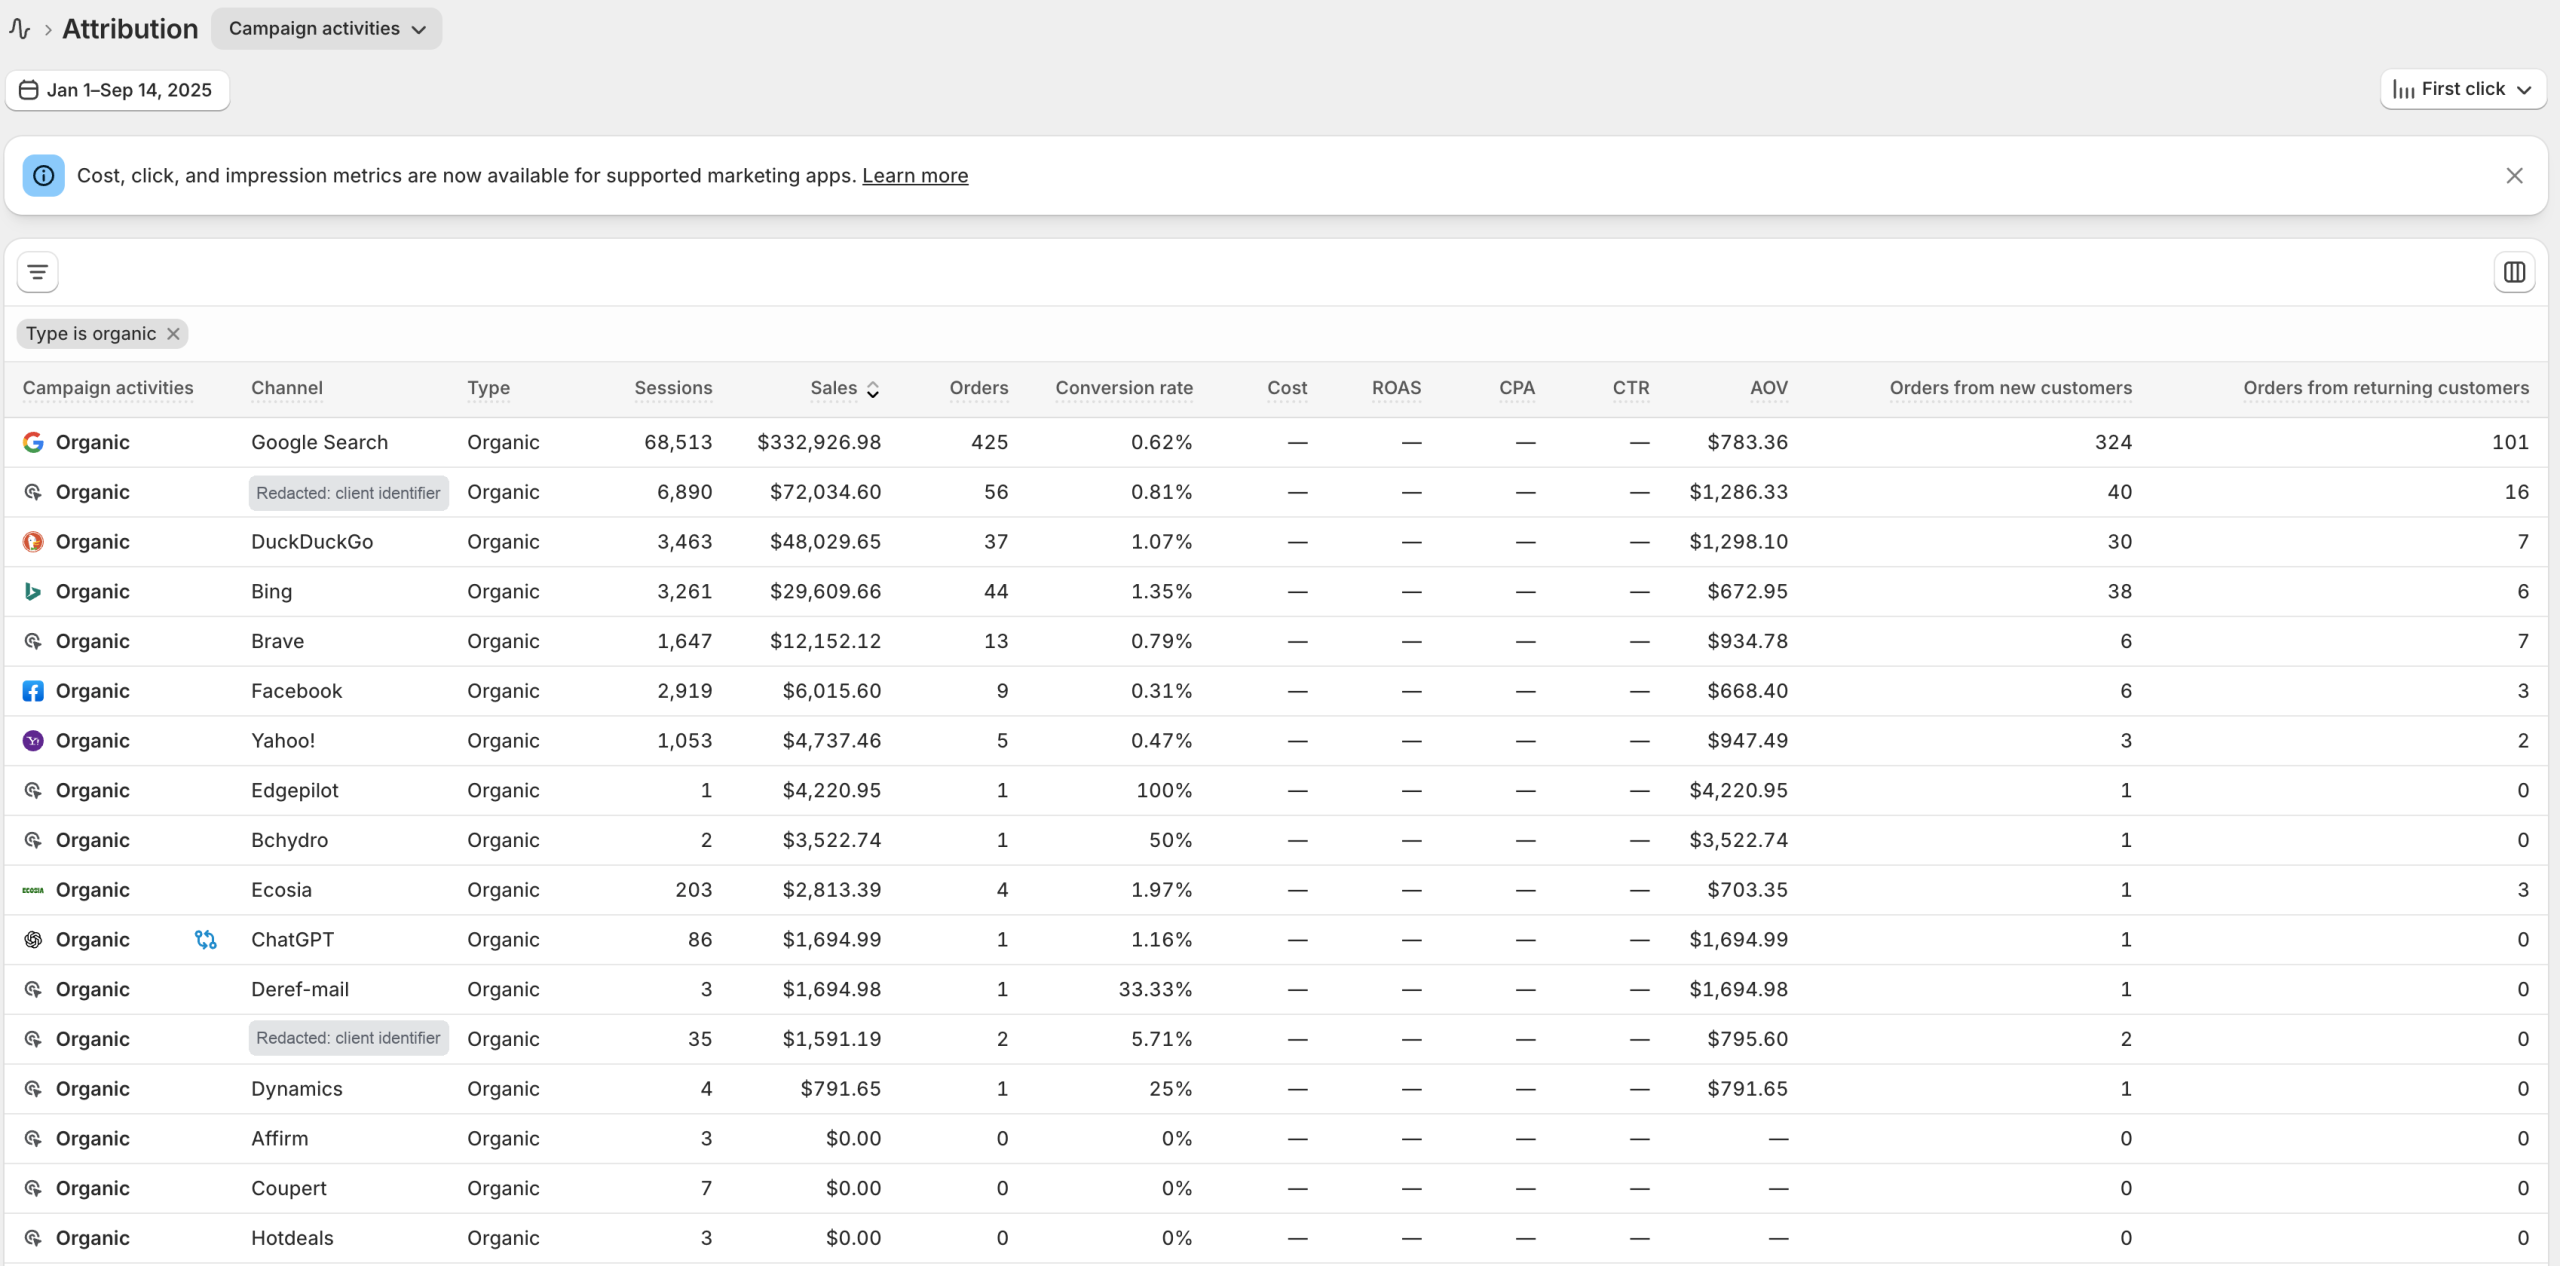
Shopify, an entirely separate system, agrees. These are its first-click numbers, summing every organic search engine it reports, not just Google:
| Metric | Prior year 2025 | This year 2026 | Change |
|---|---|---|---|
| GA4 organic search (SEO), revenue | $624,599 | $1,037,106 | +66% |
| GA4 organic search (SEO), orders | 654 | 1,028 | +57% |
| GA4 direct, revenue | $999,257 | $1,815,034 | +82% |
| GA4 direct, orders | 609 | 983 | +61% |
| Shopify organic search (SEO), revenue | $430,269.26 | $979,280.63 | +127.6% |
| Shopify organic search (SEO), orders | 528 | 1,036 | +96.2% |
| Shopify direct, revenue | $1,793,842.37 | $2,165,962.84 | +20.7% |
| Shopify direct, orders | 1,336 | 1,281 | -4.1% |
GA4 and Shopify land within about 6% of each other on total organic-search revenue ($1,037,106 vs $979,281), two independent systems telling the same story. The tools diverge more on direct traffic (GA4 shows direct revenue up 82%, Shopify up 21%), which is expected: direct is the untagged catch-all where attribution is messiest, and, as the next section shows, where most AI-driven traffic lands.


Revenue Google Analytics 4 can directly attribute to AI assistants grew from $11,699 to $52,585, up 349%. In GA4, direct revenue, the untagged bucket where most AI lands, grew from $999,257 to $1,815,034, up 82%.
| Metric | Prior year 2025 | This year 2026 | Change |
|---|---|---|---|
| AI-tagged revenue, Shopify | $8,322.30 | $53,403.45 | +542% |
| AI-tagged revenue, GA4 | $11,699 | $52,585 | +349% |
| Untagged direct revenue, Shopify | $1,793,842.37 | $2,165,962.84 | +20.7% |
| Untagged direct revenue, GA4 | $999,257 | $1,815,034 | +82% |
Two independent systems, one tracked number. GA4’s LLM total ($52,585) and Shopify’s AI-labeled entries ($53,403) land within about 2% of each other. And both undercount it: most AI referrals arrive untagged and land in direct, so $52,585 is the floor, not the ceiling.
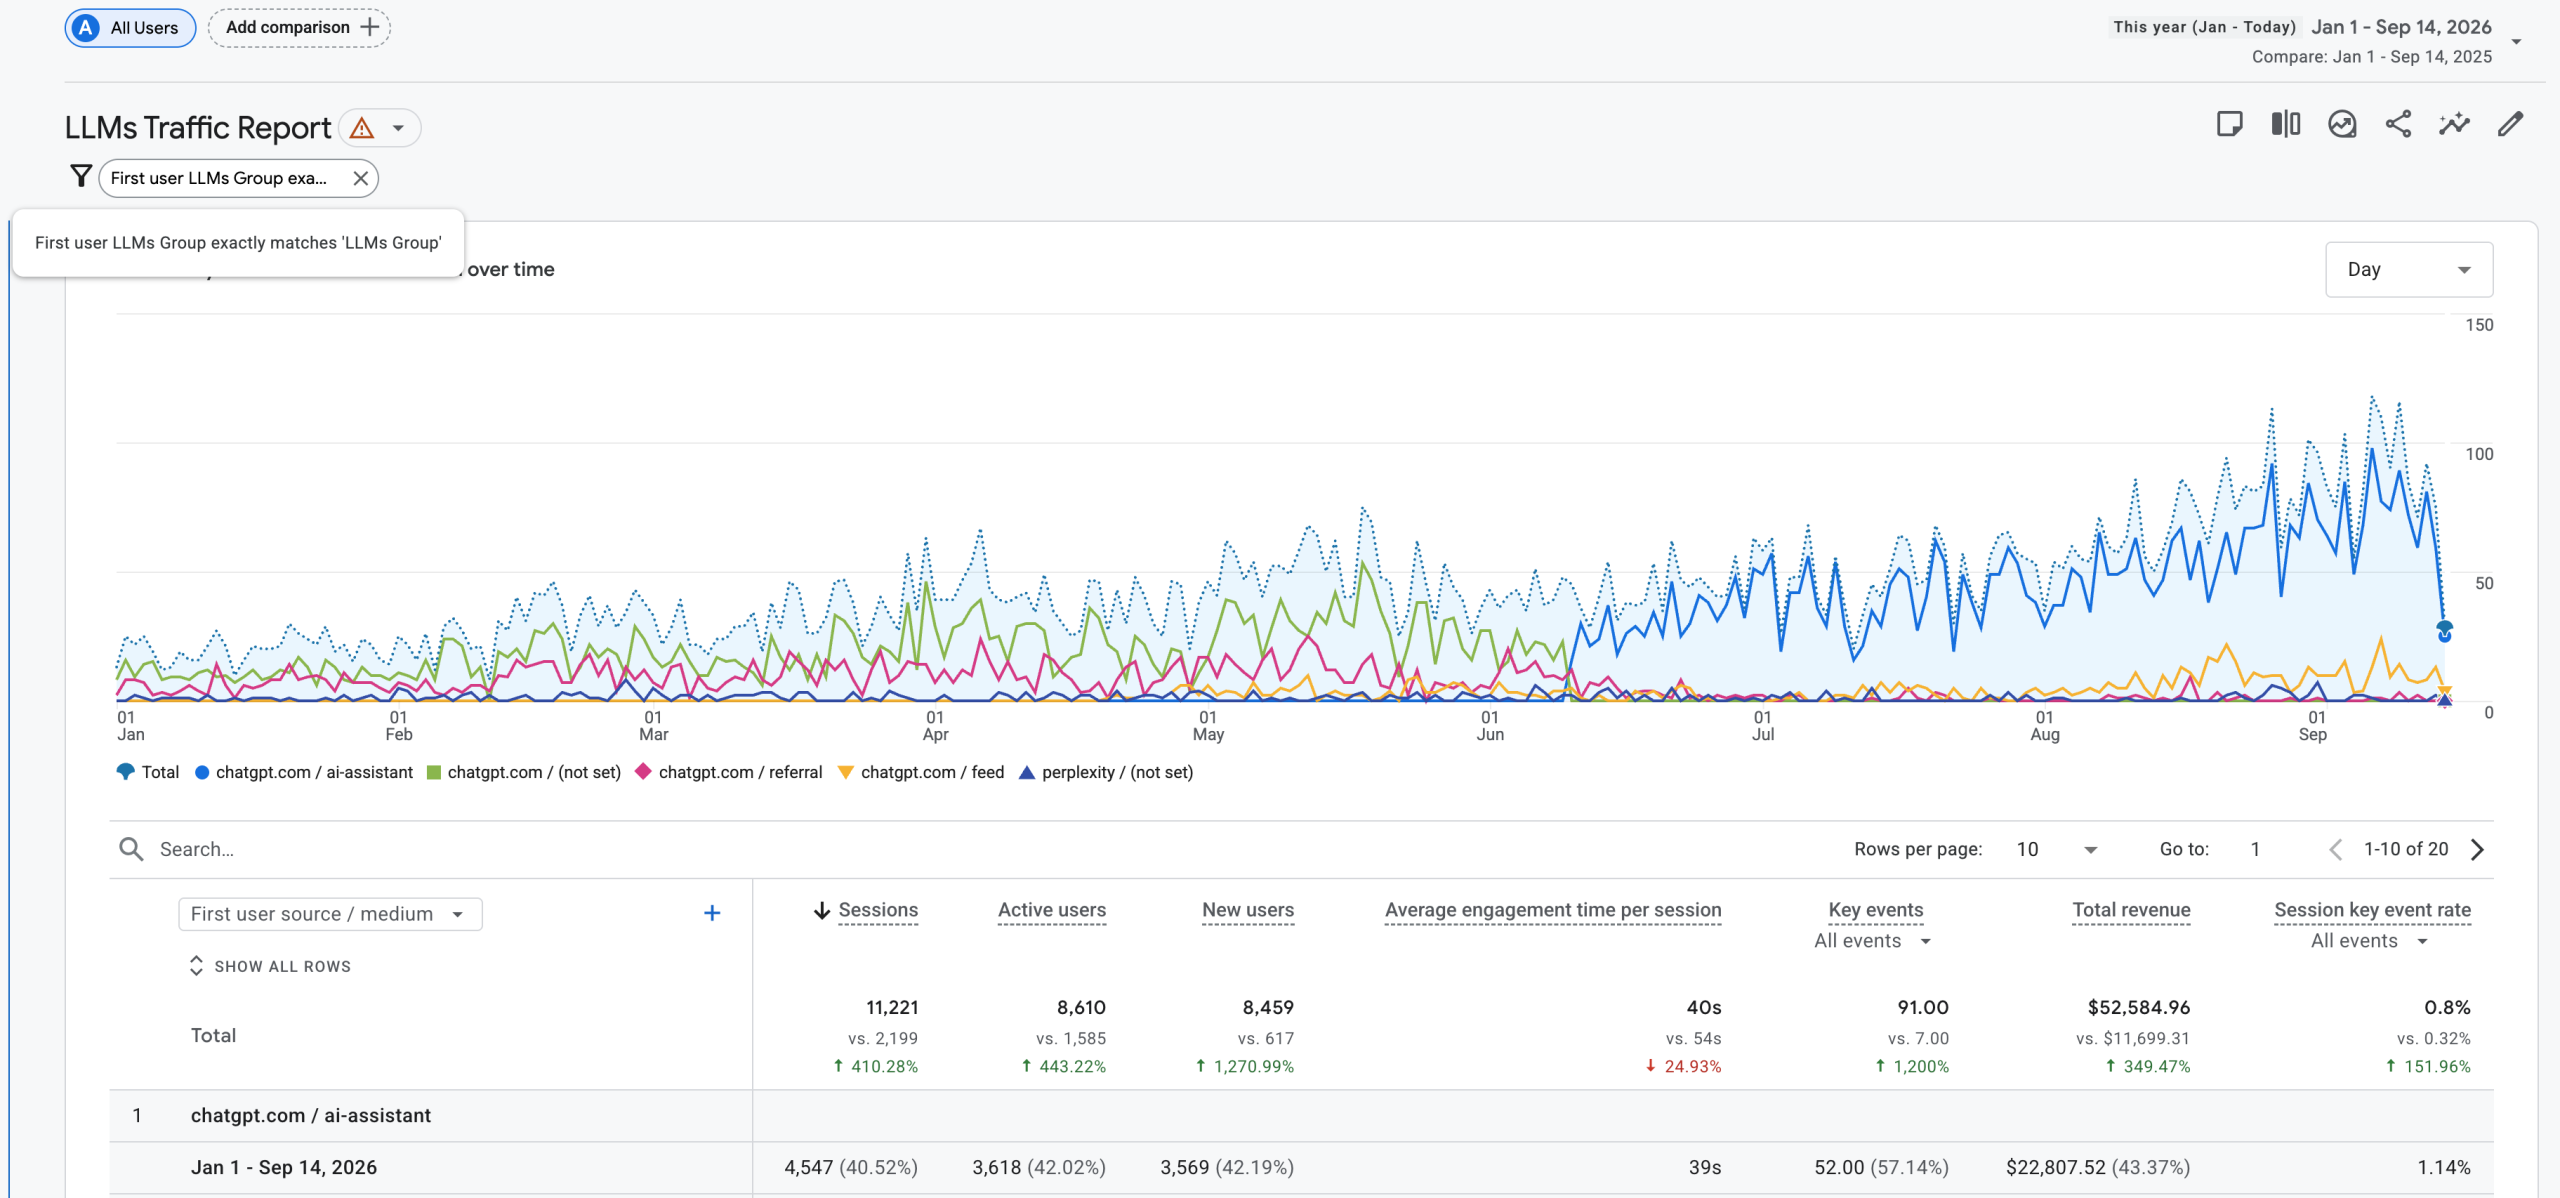
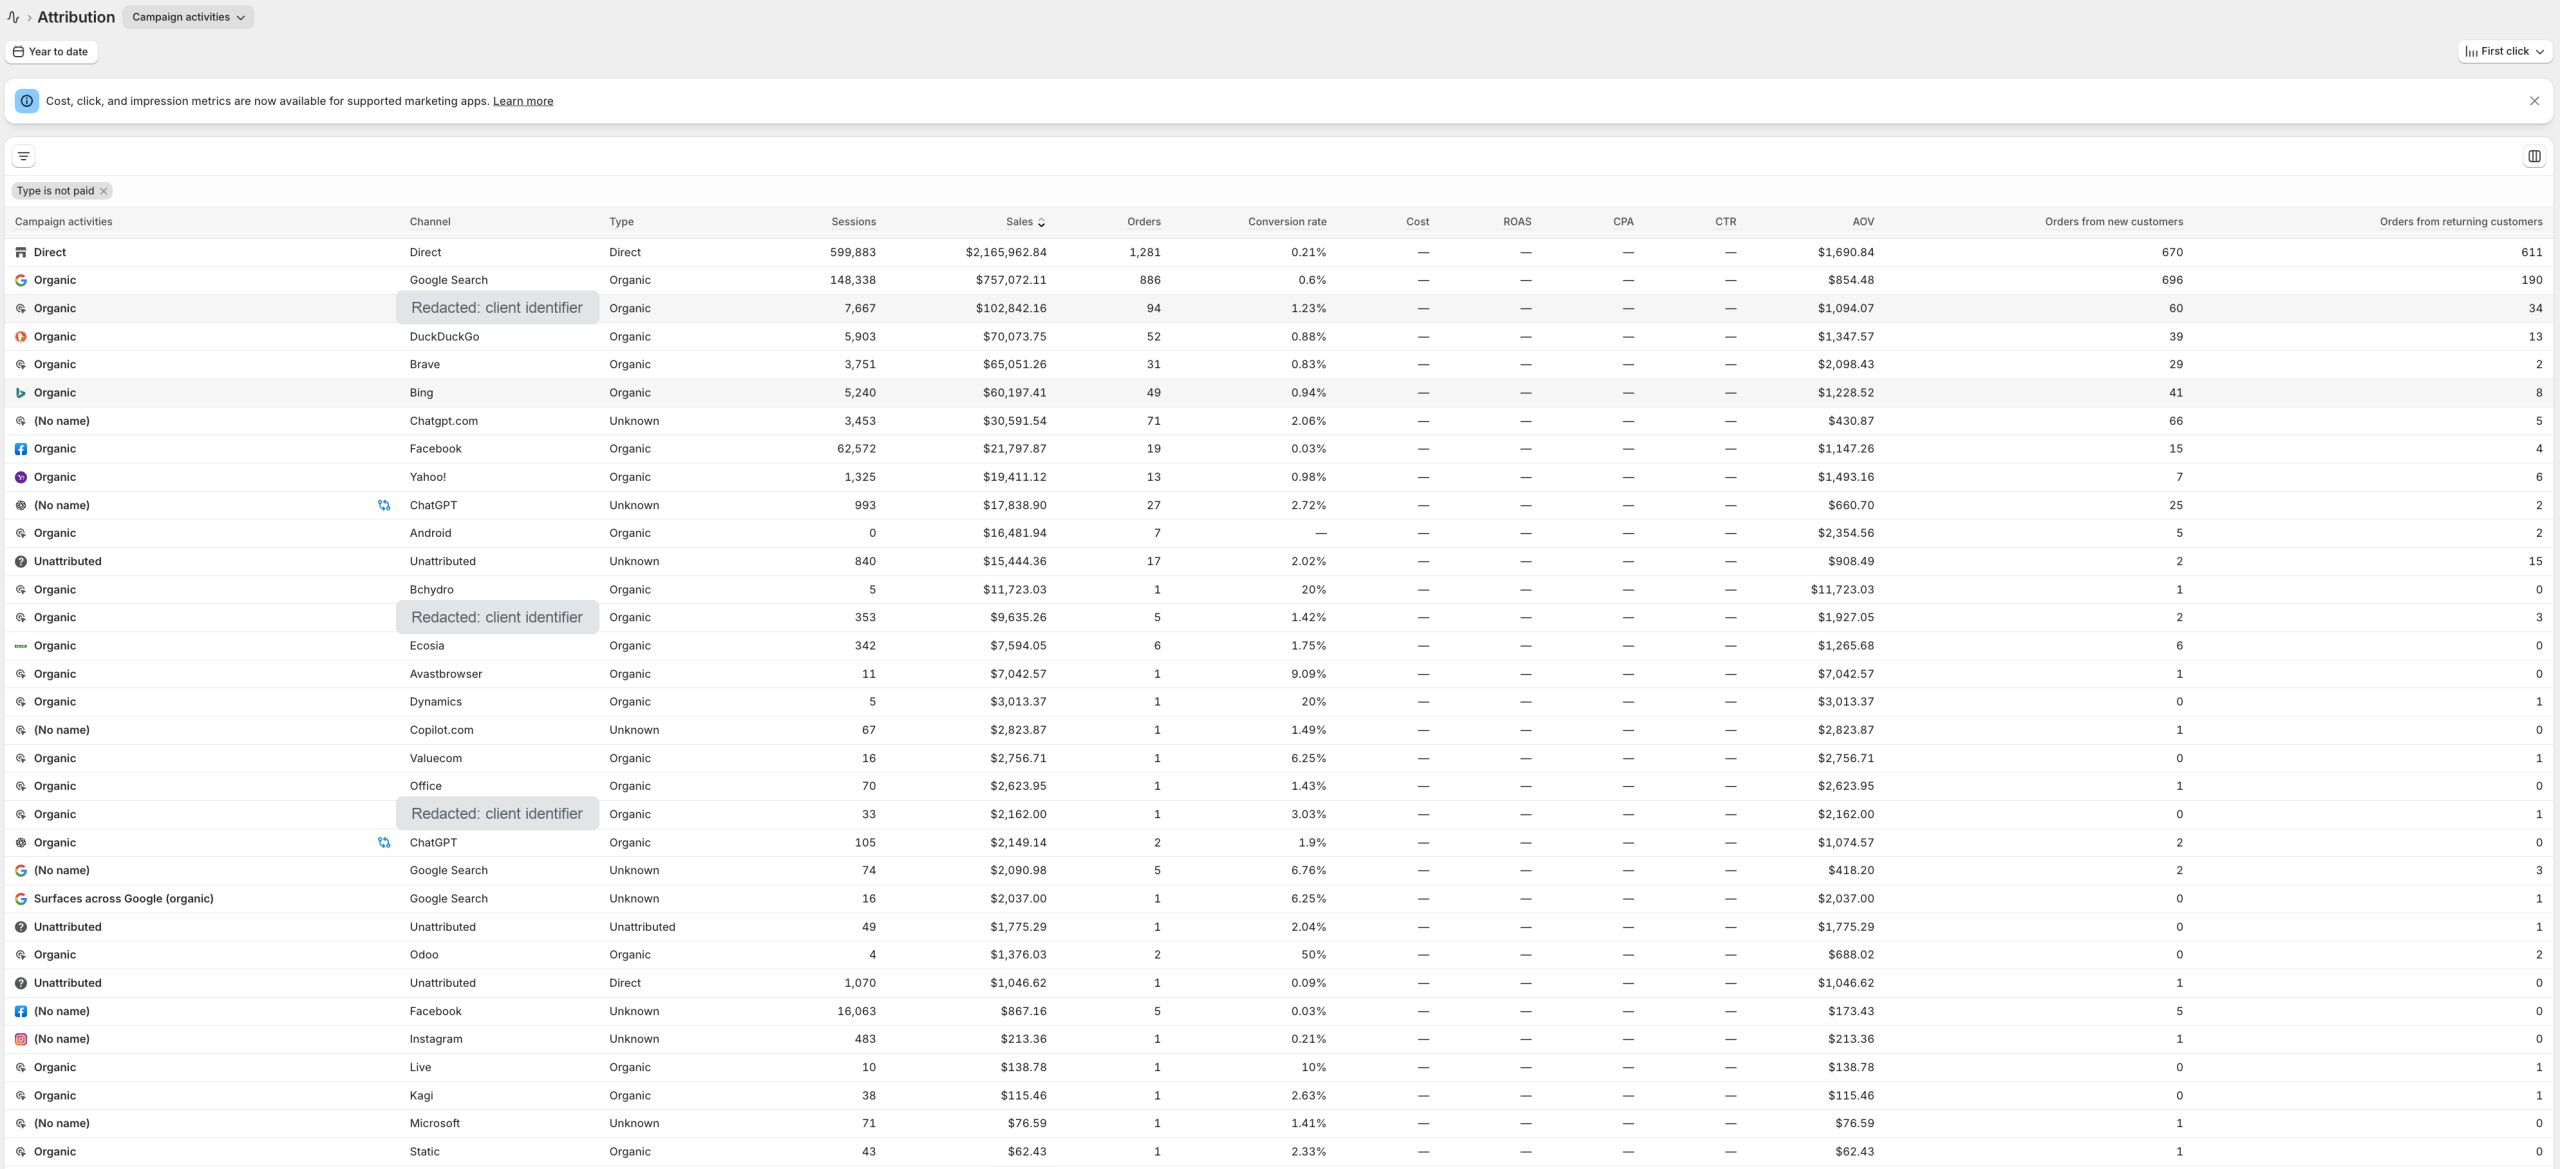
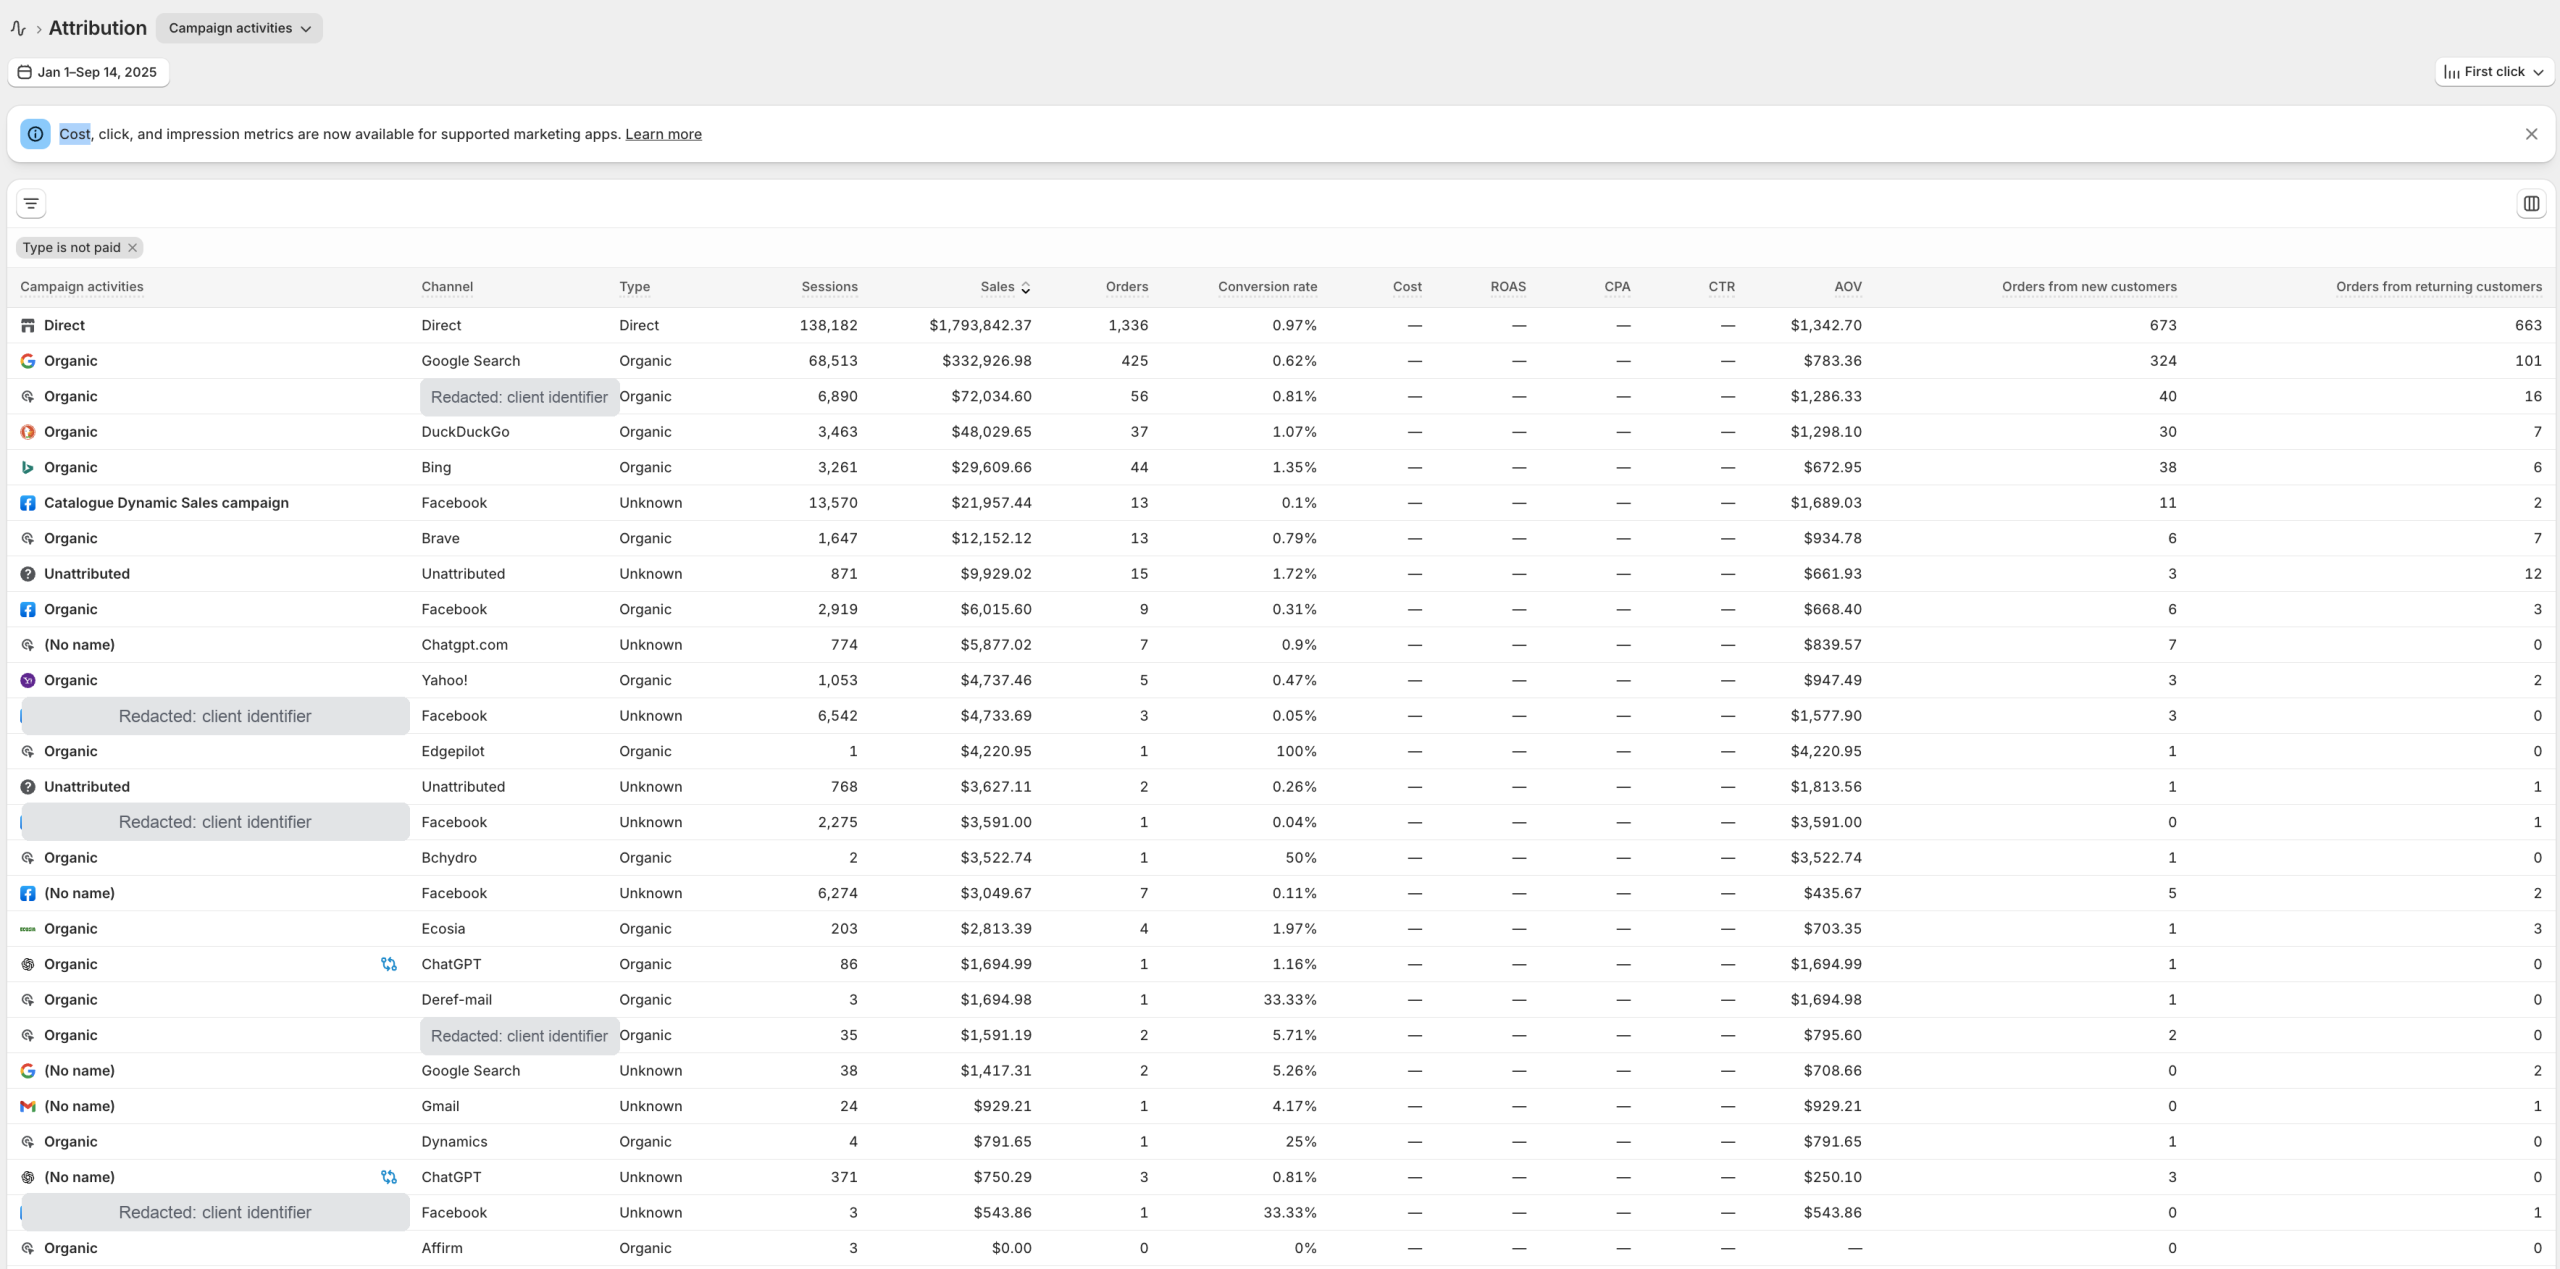
Most AI-driven revenue never carries an AI label. Assistants send buyers with no referrer, so those sales land in the one bucket that catches everything untagged: direct. The truest measure of AI demand is not the $52,585 we could tag, it is what happened to direct traffic, and that is where the story gets loud.
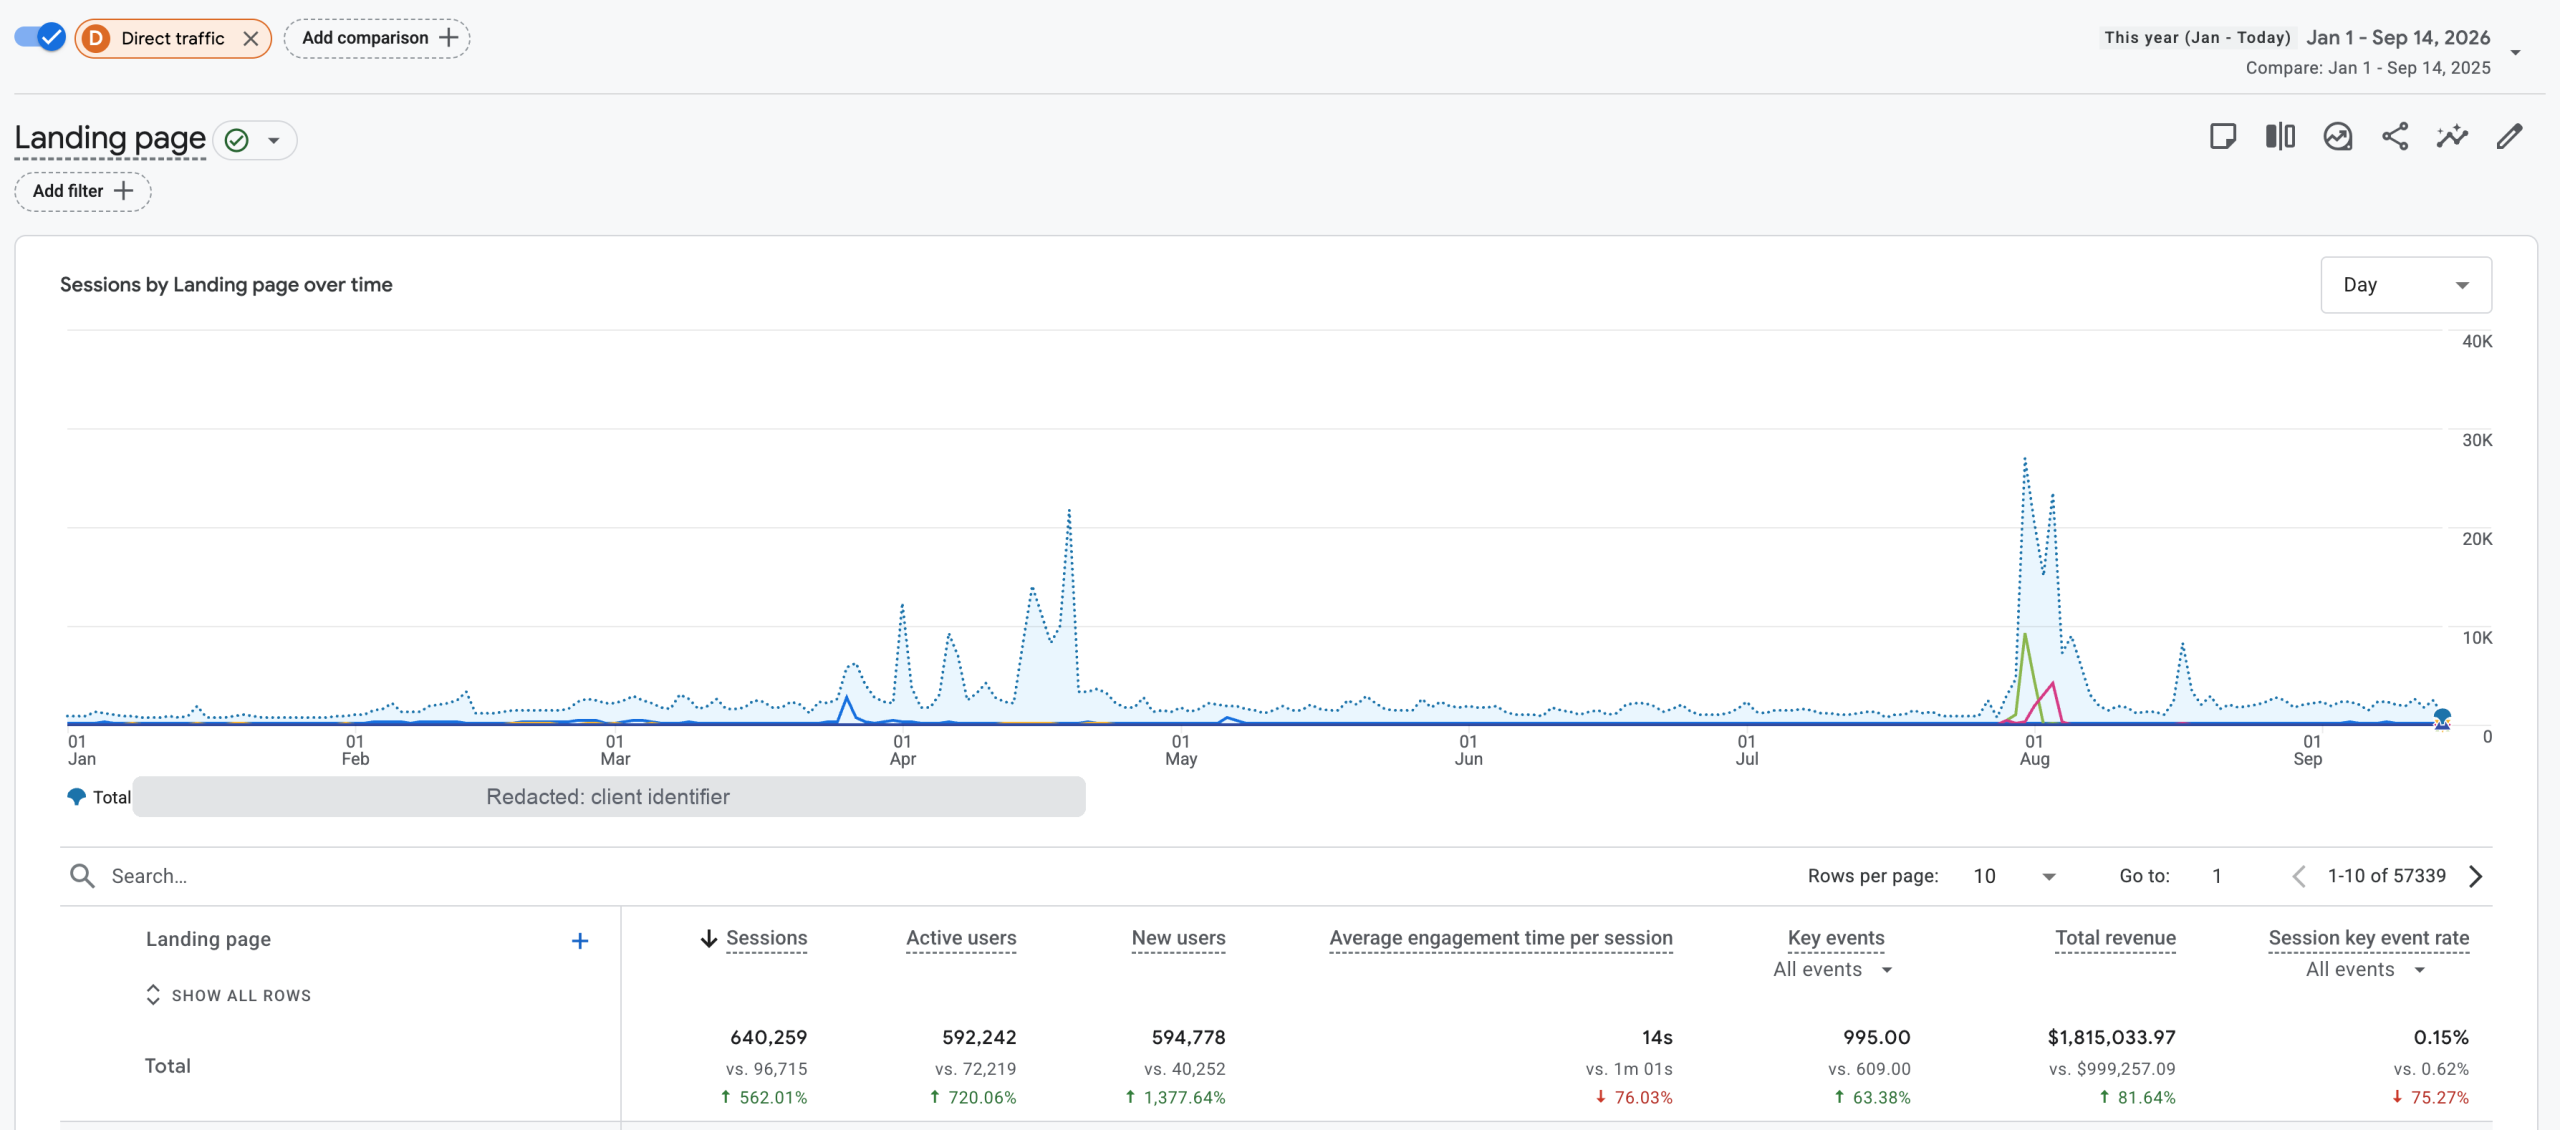
| Metric (GA4, Direct traffic) | Before (2025) | After (2026) | Change |
|---|---|---|---|
| Sessions | 96,715 | 640,259 | +562% |
| Active users | 72,219 | 592,242 | +720% |
| New users | 40,252 | 594,778 | +1,378% |
| Total revenue | $999,257 | $1,815,034 | +82% |
| Key events | 609 | 995 | +63% |
| Avg engagement time / session | 1m 01s | 14s | -76% |
Here is the tell. Every volume metric exploded, but average engagement time per session collapsed from 1 minute 1 second to just 14 seconds. Real shoppers do not average 14 seconds on a site, and a real audience does not swing this hard in one direction on every single metric except time on page. That is the fingerprint of AI-mediated traffic: assistants like ChatGPT read the page, pull what they need, and hand the answer back inside the chat, so the recorded session lasts seconds even though a real person is on the other end deciding to buy. Engagement time cratering while revenue rose 82% is what it looks like when people arrive already sold, sent by an AI that did the reading for them.
To be clear: this brand already did about $1M from direct last year, and we are not claiming every dollar of the increase is us, or even all of it AI. But direct grew 82%, more than $815,000, the traffic shape is unmistakably AI, and these are buyers, not browsers. This is revenue we point to as ours to influence, and leaving it out would understate what happened.
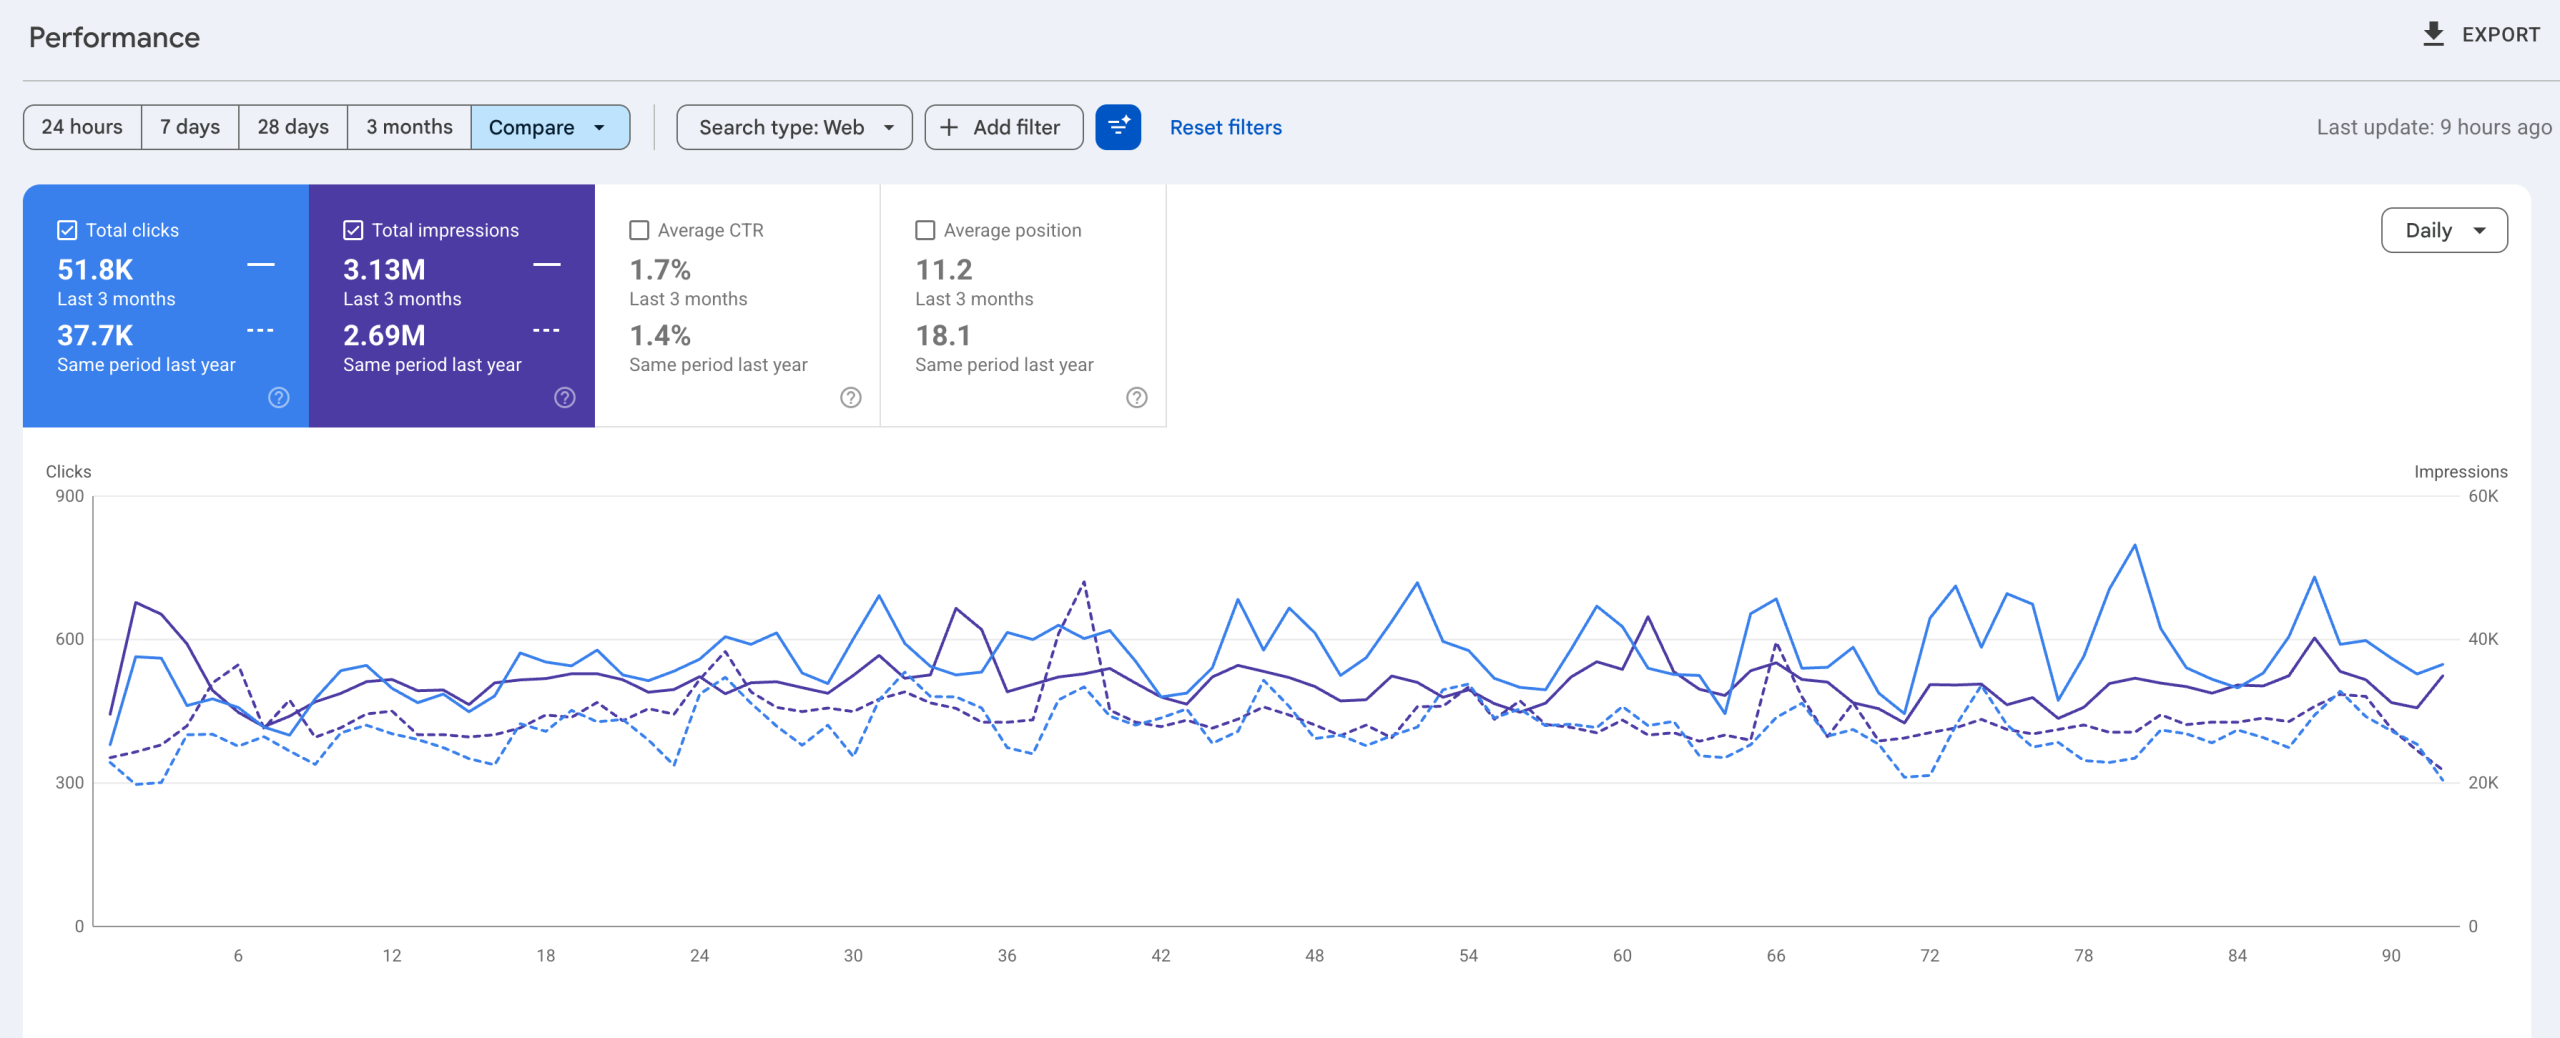
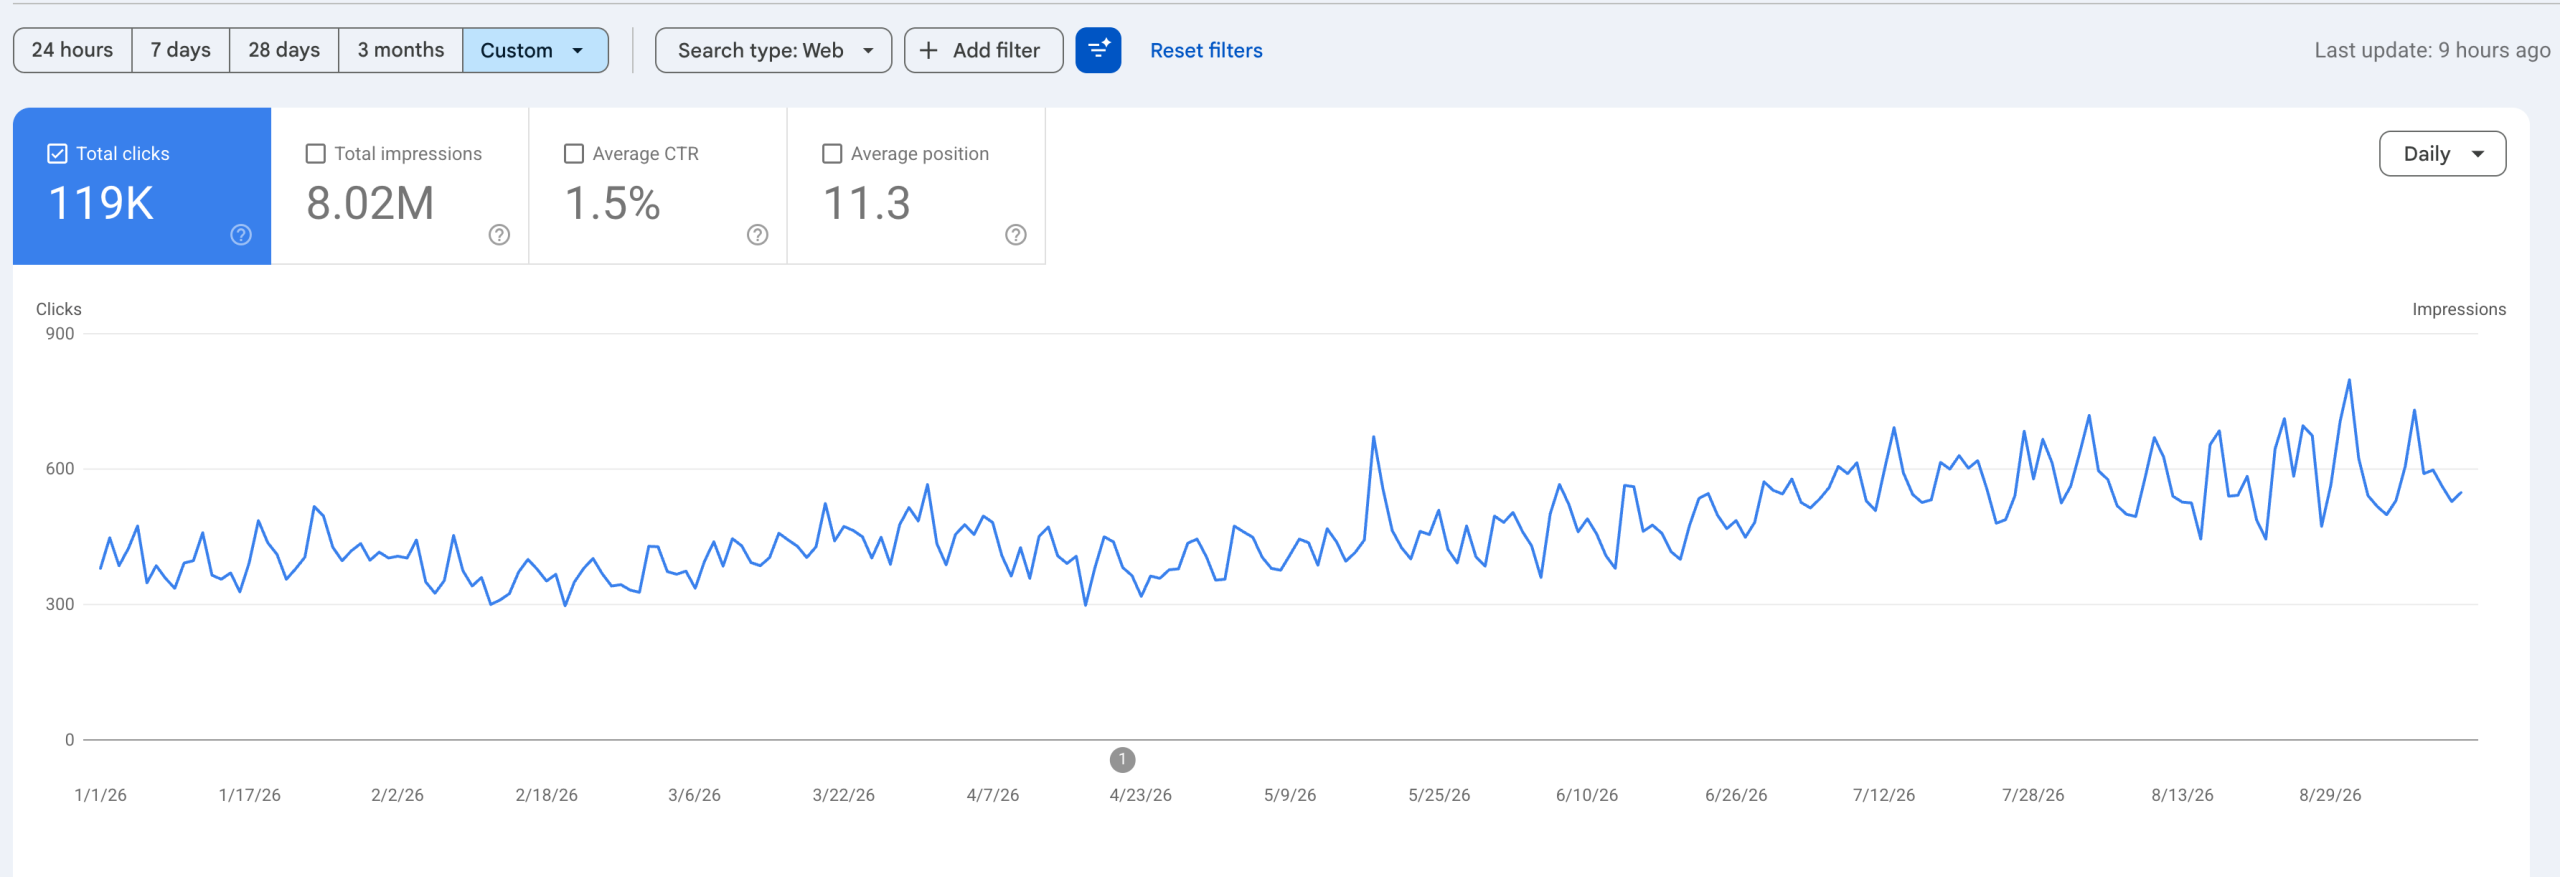
Google Search Console is the source of truth for what Google itself sees. Year over year:
That last one is worth a beat, because the tools show it in red, like a decline. It is not. Average position is like a golf score: lower is better, and it moved from about 18 to about 11. What makes that impressive is that it improved while clicks doubled and impressions grew 71%. Normally, when a site starts ranking for far more queries, average position gets dragged the other way, because you are suddenly showing up for lots of new terms further down the page. Improving average position while massively expanding reach is the hard version, and it is the signal that the new rankings are quality, not filler.
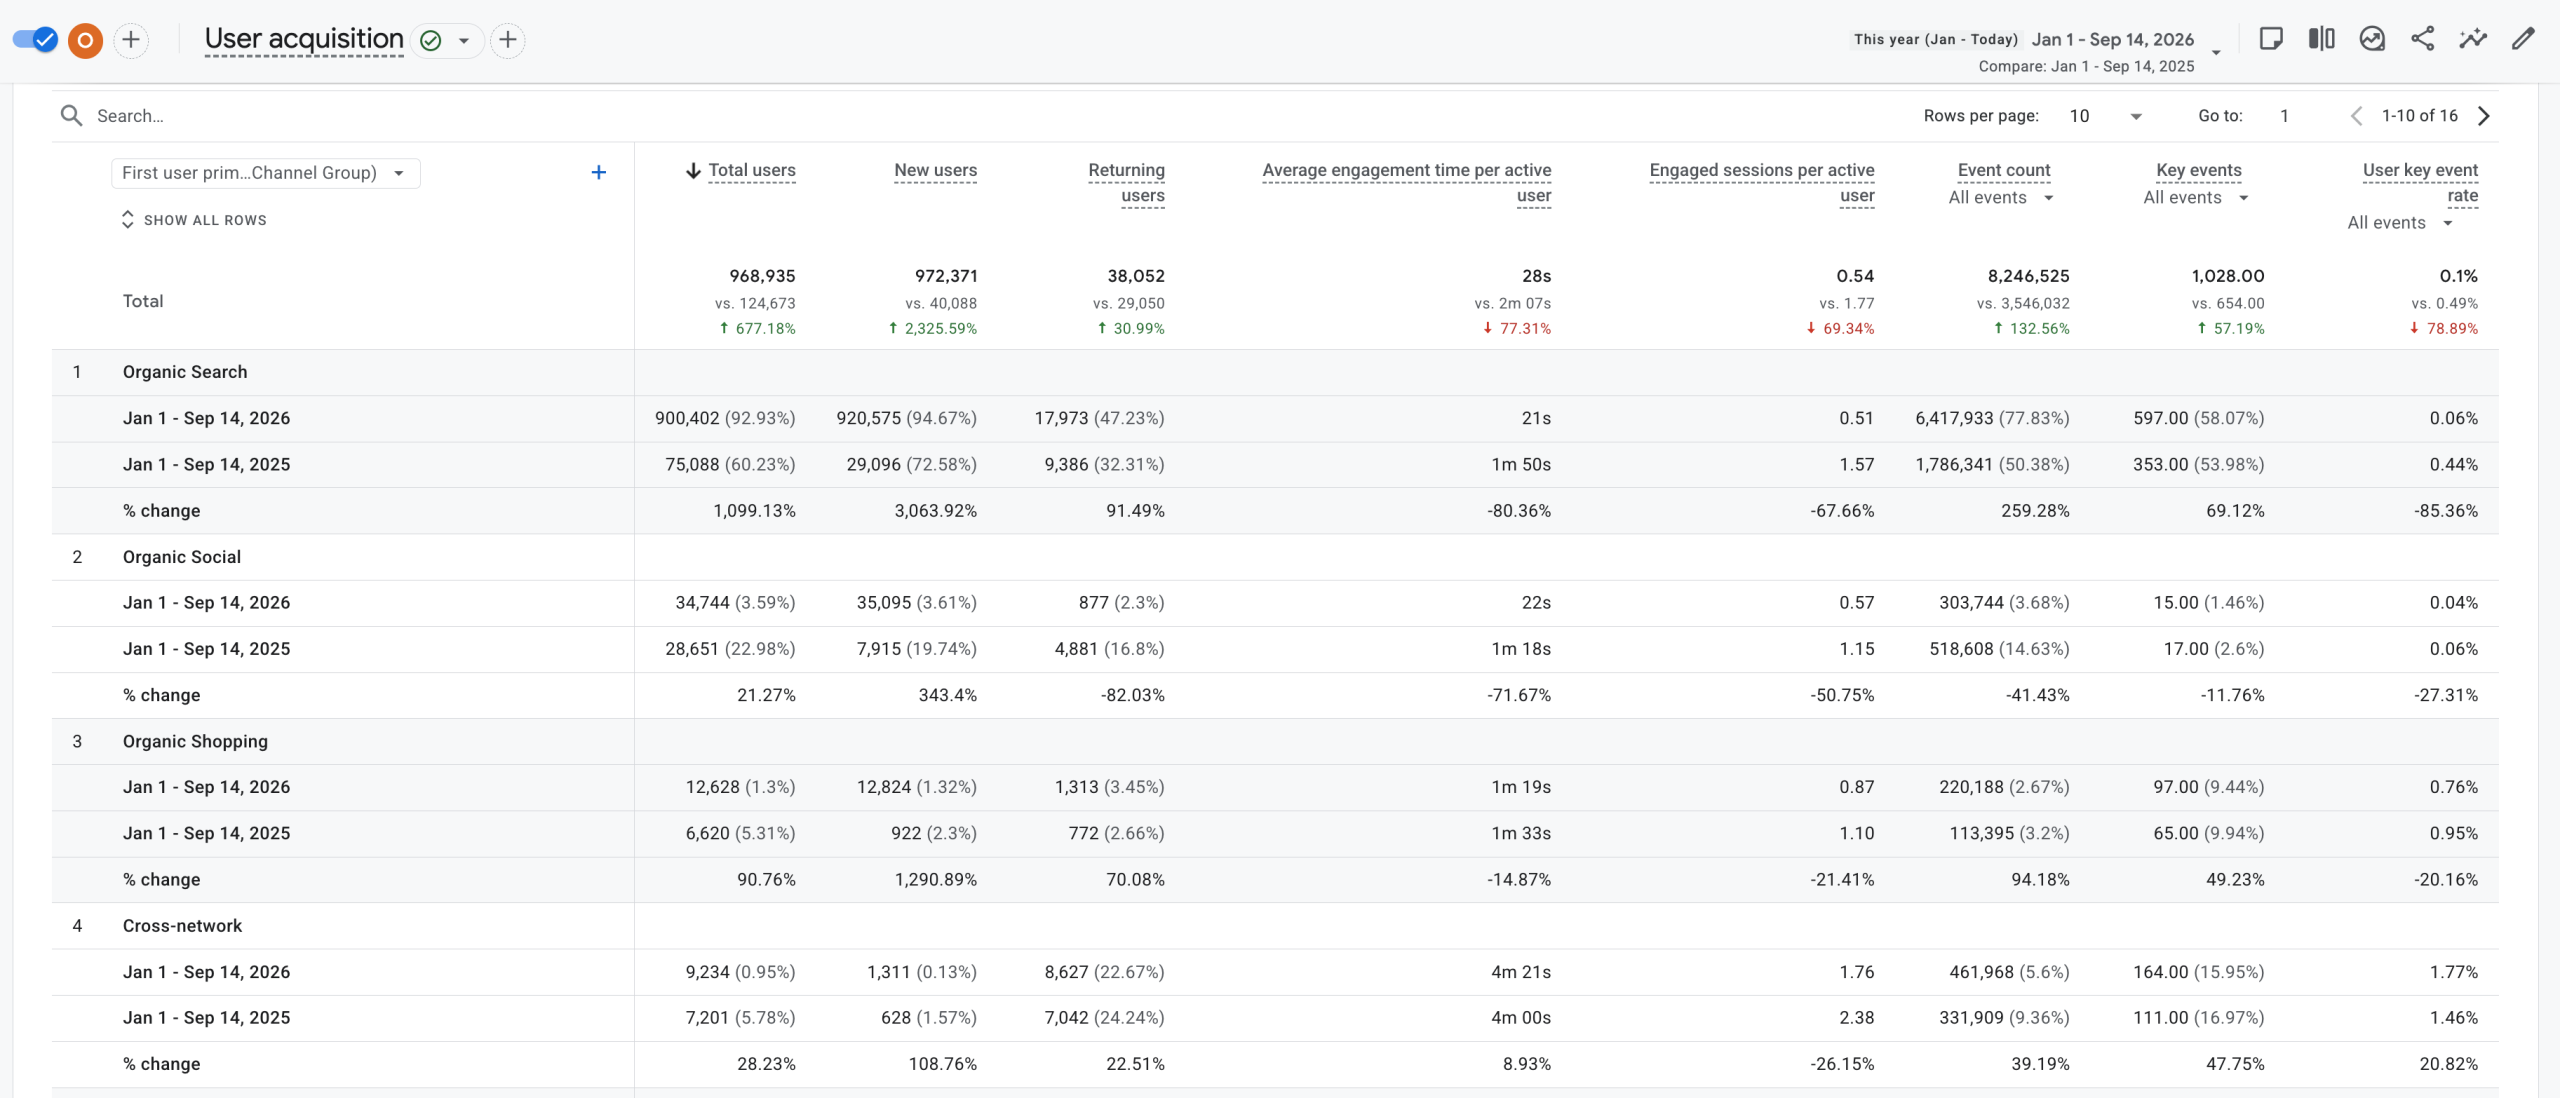
There is a natural control group in the channel data, too. The two channels our work drives, Organic Search and Organic Shopping, grew first-time users by 1,099% and 91% year over year. Organic Social, which we do not touch, grew about 21% over the same period. Same brand, same nine months: the channels we ran moved on a completely different order of magnitude than the one we did not.
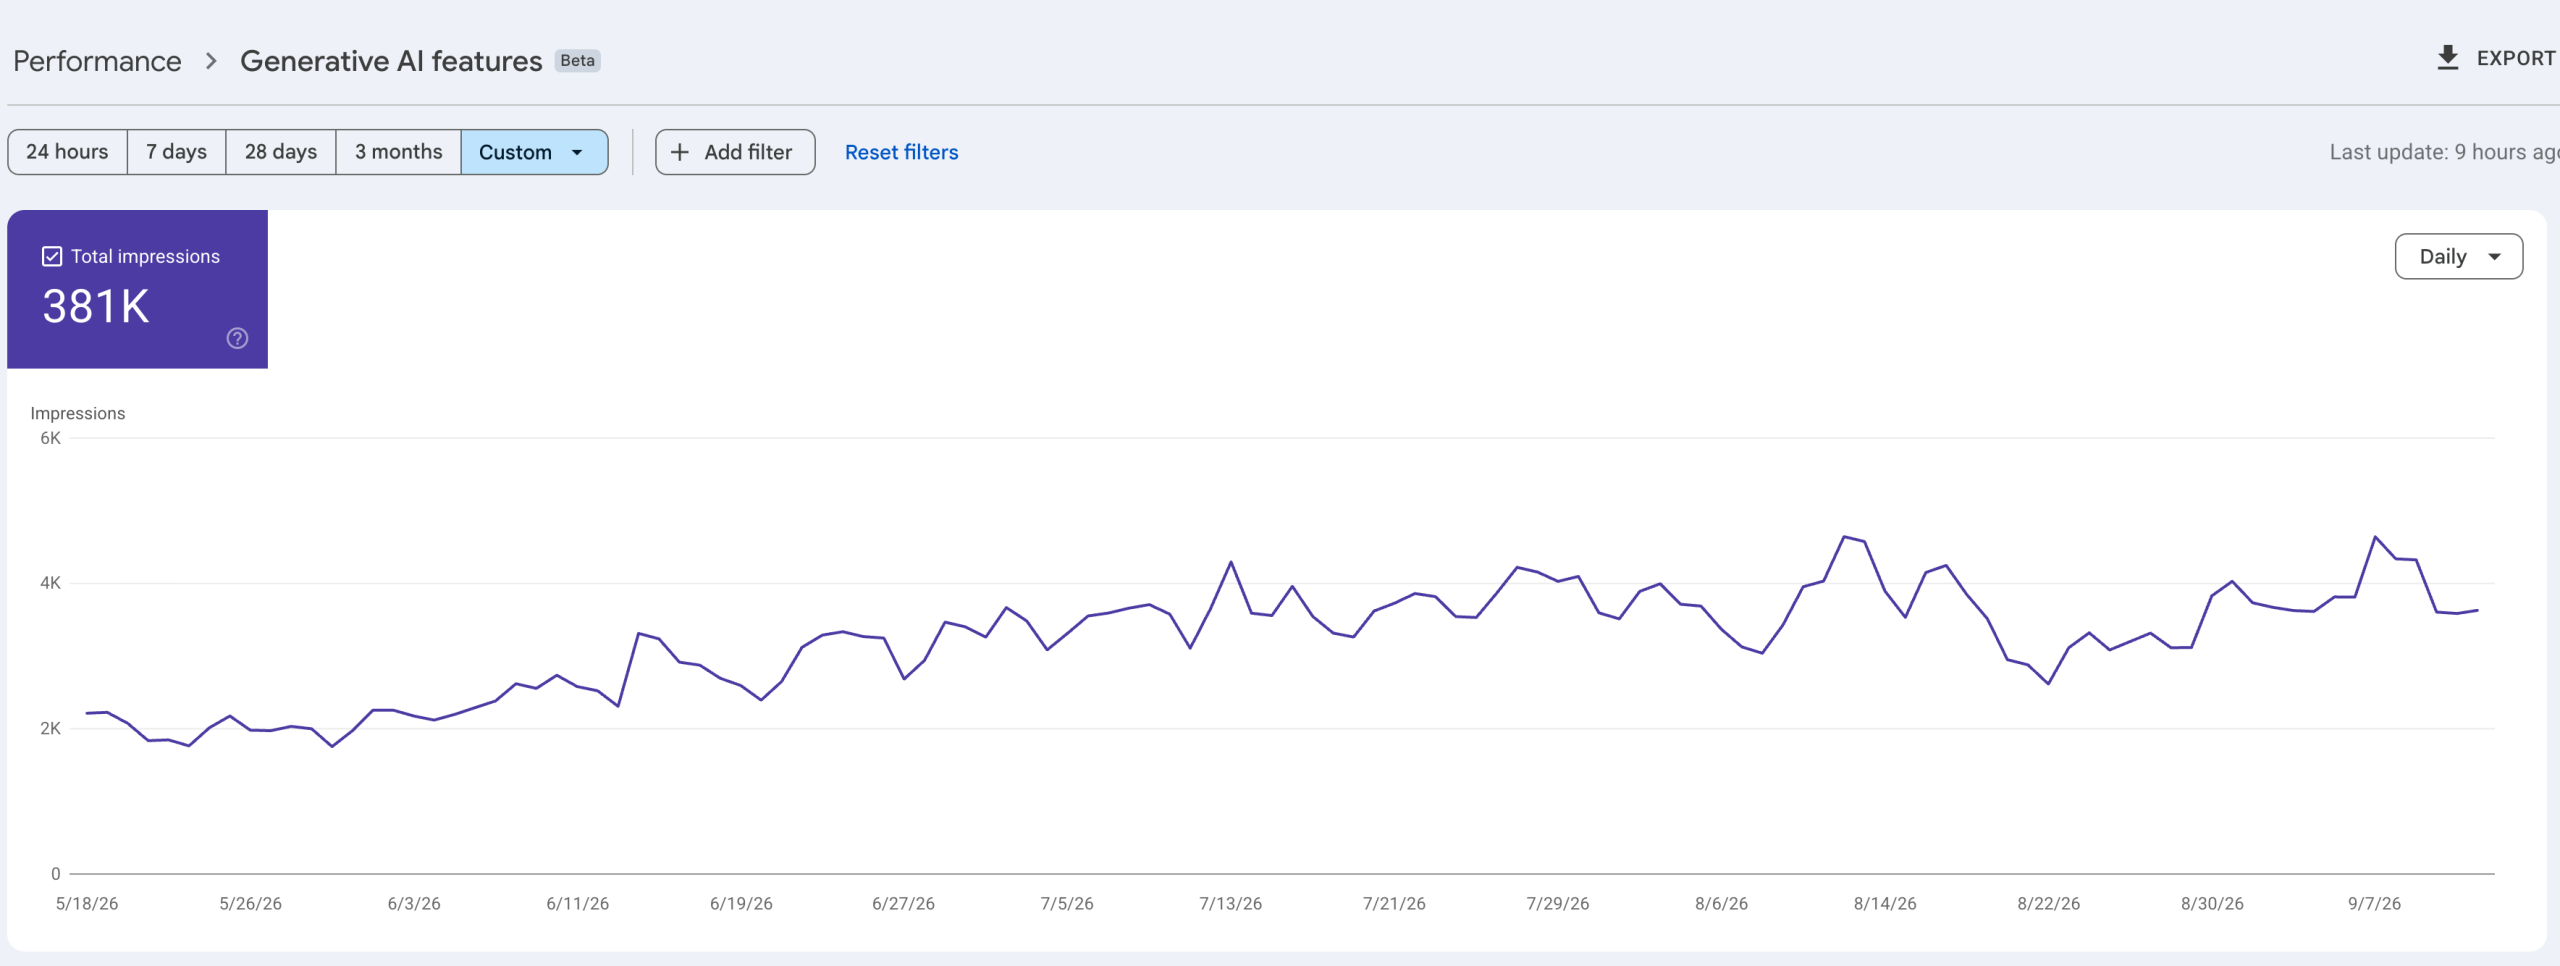
Google’s own AI answers are pulling the brand in too. Since Search Console began tracking it in mid-May, the brand has logged 381,000 impressions inside Google’s generative AI features, and climbing.
Sources: the client’s own Google Analytics 4 and Google Search Console (the same numbers their team and Google see) plus Shopify’s native Analytics. Attribution: GA4 uses its default channel grouping; Shopify figures use first-click. Dates: identical calendar ranges in 2026 and 2025. Currency: CAD.
Where a screenshot showed the client’s name, products, or campaign labels, those are covered with a gray box marked “Redacted: client identifier.” Only identifying text is hidden; no metric, date, or chart is altered.
One limitation: we do not claim sole credit for every dollar. The client actively works on their own site and business alongside us. What we can show is that the channels we own, organic search and AI search, are the ones that grew, and by how much.
The demand already existed; the brand just was not capturing it in search. We fixed the technical drag, turned existing pages into pages that rank and sell, built steady authority, and made sure the brand shows up when people ask an AI. Consistency over nine months did the rest. Turn off paid and it stops; this keeps compounding.